Fig. 5
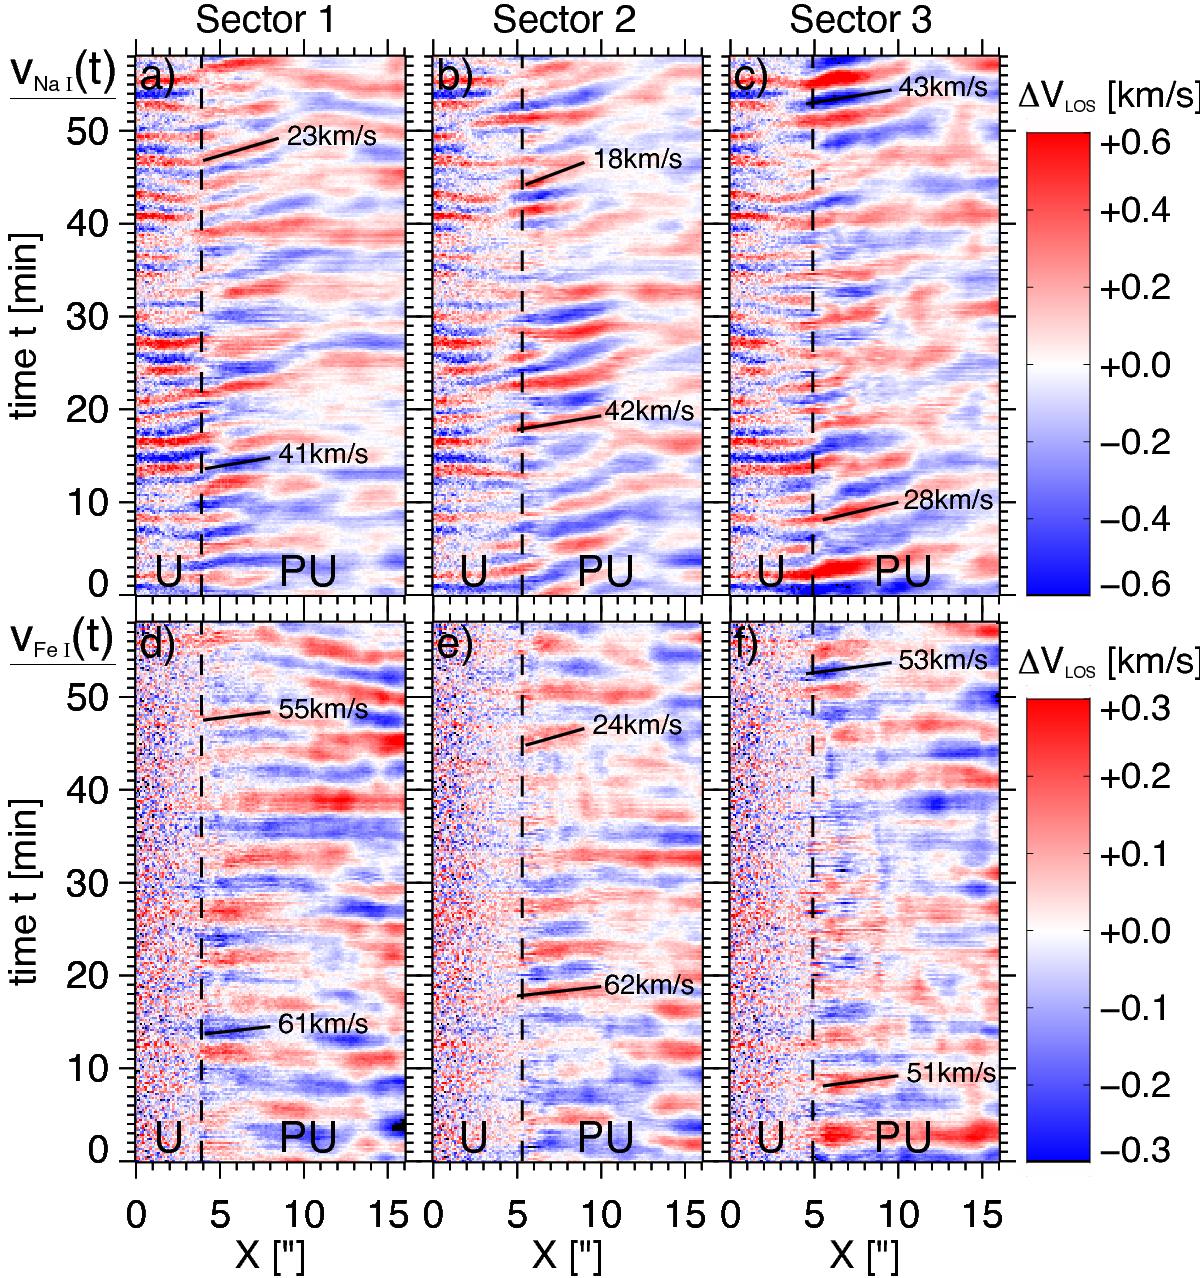
Temporal evolution (in min) of the relative velocities in the sunspot atmosphere. The analysis of time slices was performed for the Doppler velocities VNa i (panels a)–c)) of Na i 589.6 nm and VFe i (d)–f)) of Fe i 630.15 nm in all three sectors, also shown in Fig. 3. For each sector, the azimuthal average at a radial distance X (in arcsec) from the spot center was calculated. The dashed lines mark the umbral boundary. The velocity scale ΔVLOS ranges between ±0.6 km s-1 (a)–c)) and ±0.3 km s-1 (d)–f)). The black bars trace the apparent wave trains.
Current usage metrics show cumulative count of Article Views (full-text article views including HTML views, PDF and ePub downloads, according to the available data) and Abstracts Views on Vision4Press platform.
Data correspond to usage on the plateform after 2015. The current usage metrics is available 48-96 hours after online publication and is updated daily on week days.
Initial download of the metrics may take a while.