Fig. 4
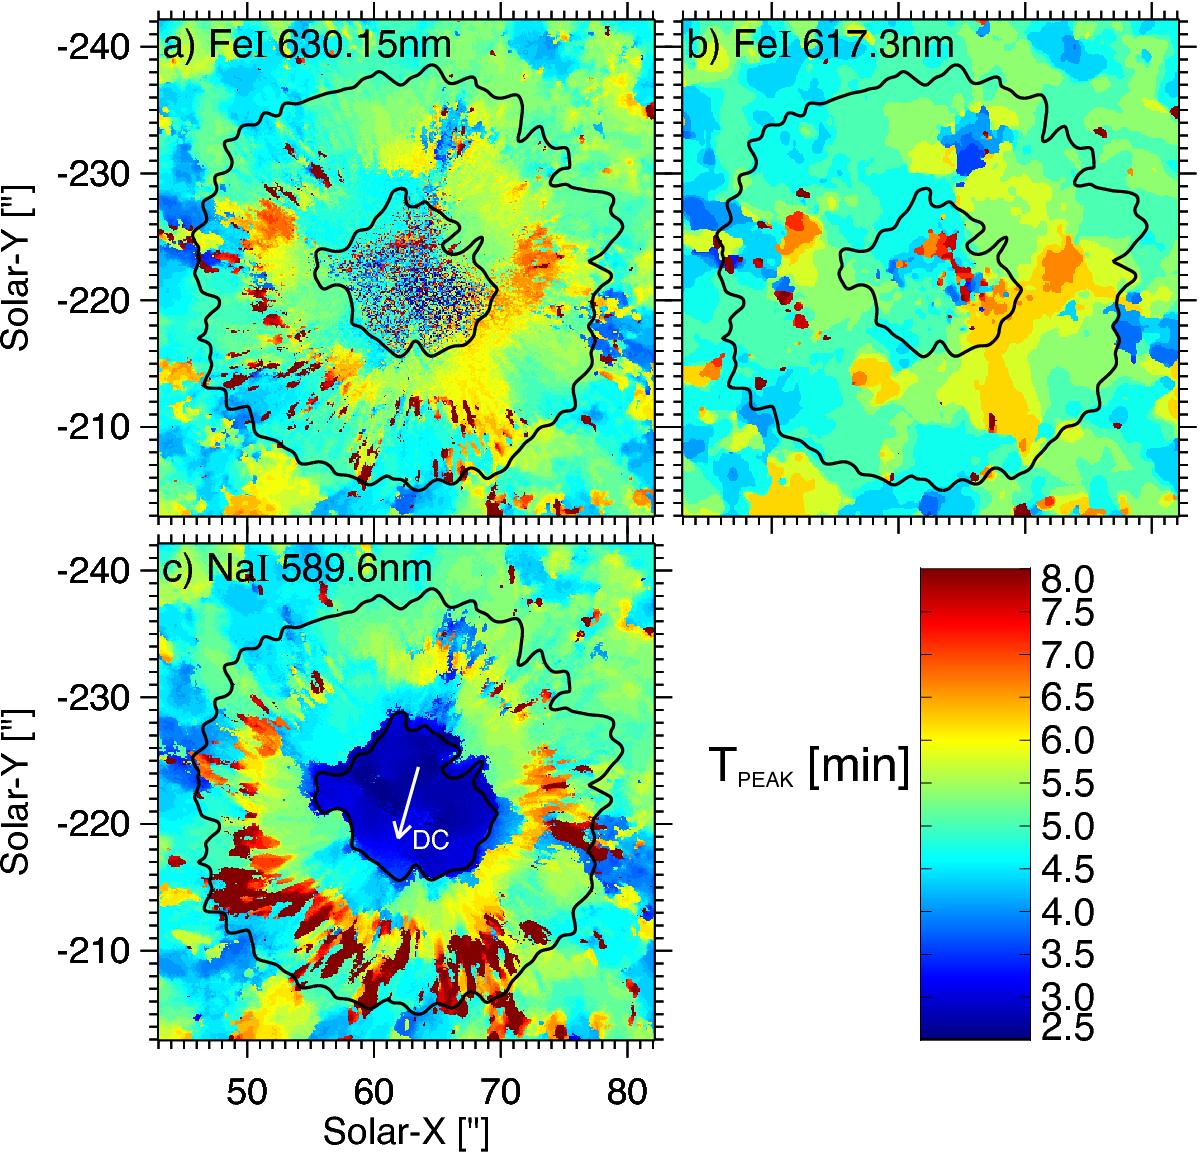
Spatial distribution of the peak periods from the global power spectra of Doppler velocity oscillations. The major periods TPEAK (in min) are shown for a) Fe i 630.15 nm; b) Fe i 617.3 nm (HMI); and c) Na i 589.6 nm. The scale ranges from 2.5 min (dark blue) to 8 min (dark red). The black contours mark the umbral and penumbral boundaries in continuum intensity. The white arrow is pointing to the disk center.
Current usage metrics show cumulative count of Article Views (full-text article views including HTML views, PDF and ePub downloads, according to the available data) and Abstracts Views on Vision4Press platform.
Data correspond to usage on the plateform after 2015. The current usage metrics is available 48-96 hours after online publication and is updated daily on week days.
Initial download of the metrics may take a while.