Fig. 2
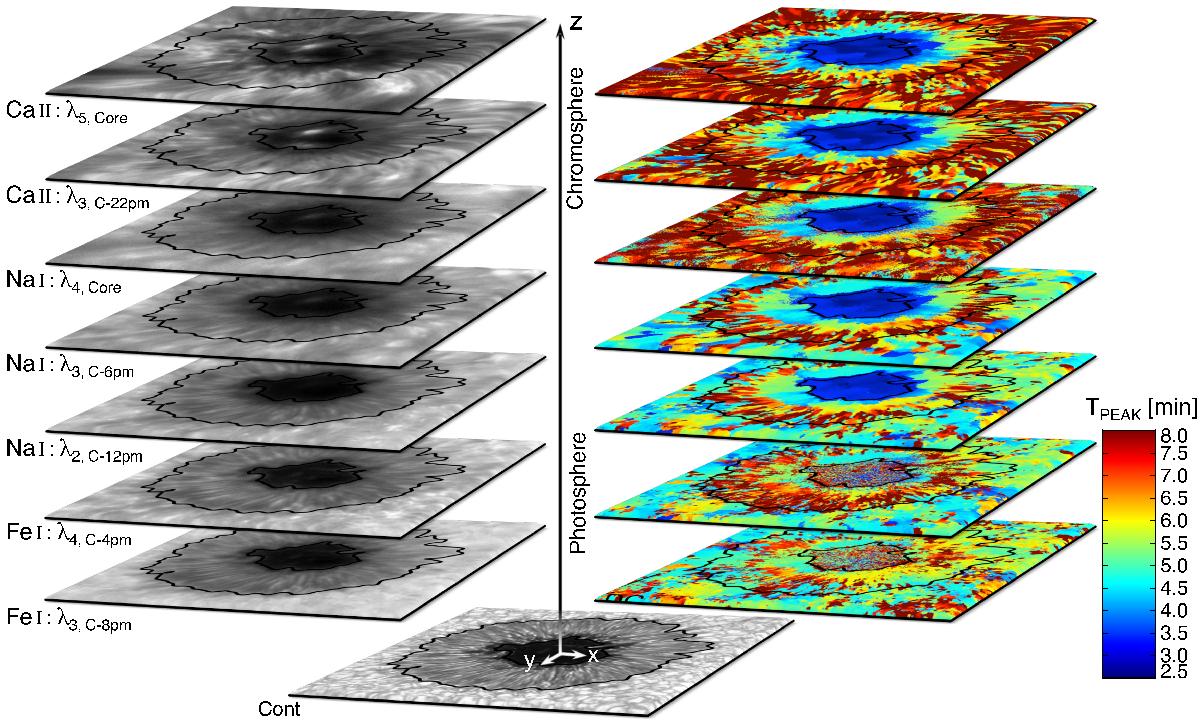
Three-dimensional view of intensities and peak periods of intensity wave power of NOAA11823 at various wavelength positions. The intensities (left) show the sunspot at August 21st 2013 at 15:00:06 UTC (± 3 s). The images along the z-axis belong to several line core and wing positions of Fe i 630.15 nm, Na i 589.6 nm, and Ca ii 854.2 nm. The corresponding time-averaged (≈ 1h) distribution of peak periods TPEAK of the intensity wave power is shown on the right. The periods are scaled from 2.5 min (dark blue) to 8 min (dark red). The black contours indicate the location of the umbra (inner) and penumbra (outer) in continuum intensity (bottom panel). Whereas the length of the axis arrows represent distances around 1.5 Mm, the image positions along the z-axis are not to scale.
Current usage metrics show cumulative count of Article Views (full-text article views including HTML views, PDF and ePub downloads, according to the available data) and Abstracts Views on Vision4Press platform.
Data correspond to usage on the plateform after 2015. The current usage metrics is available 48-96 hours after online publication and is updated daily on week days.
Initial download of the metrics may take a while.