Fig. 1
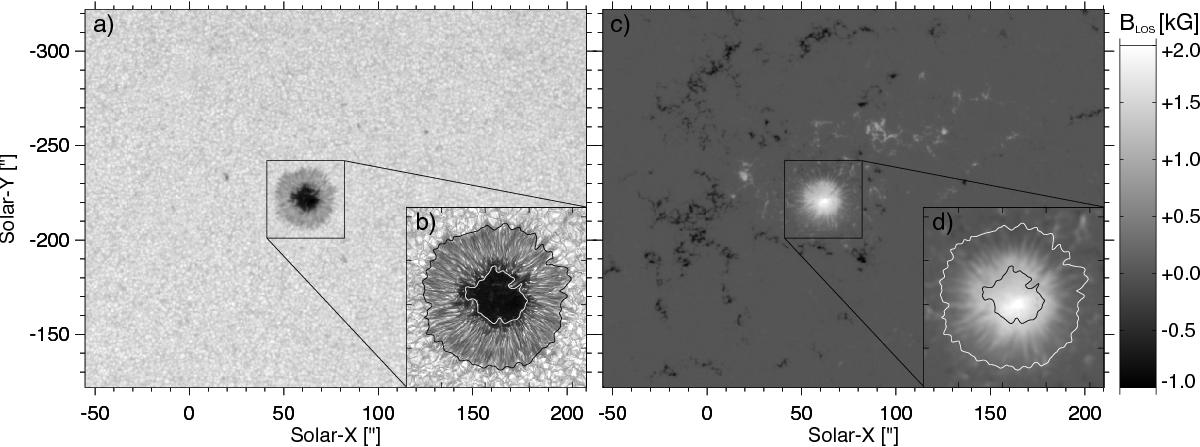
NOAA11823 as seen in continuum (left panels) and line-of-sight magnetic field strength (right panels) on August 21st 2013 at 15:00:45 UTC as observed by HMI (a)+c)+d)) and ROSA b). The black squares mark the analyzed region. The insets (b)+d)) show the sunspot with contours indicating the inner and outer penumbral boundary from the time-averaged HMI continuum intensity. The HMI magnetogram is scaled from −1 kG (black) to 2 kG (white).
Current usage metrics show cumulative count of Article Views (full-text article views including HTML views, PDF and ePub downloads, according to the available data) and Abstracts Views on Vision4Press platform.
Data correspond to usage on the plateform after 2015. The current usage metrics is available 48-96 hours after online publication and is updated daily on week days.
Initial download of the metrics may take a while.