Fig. 7
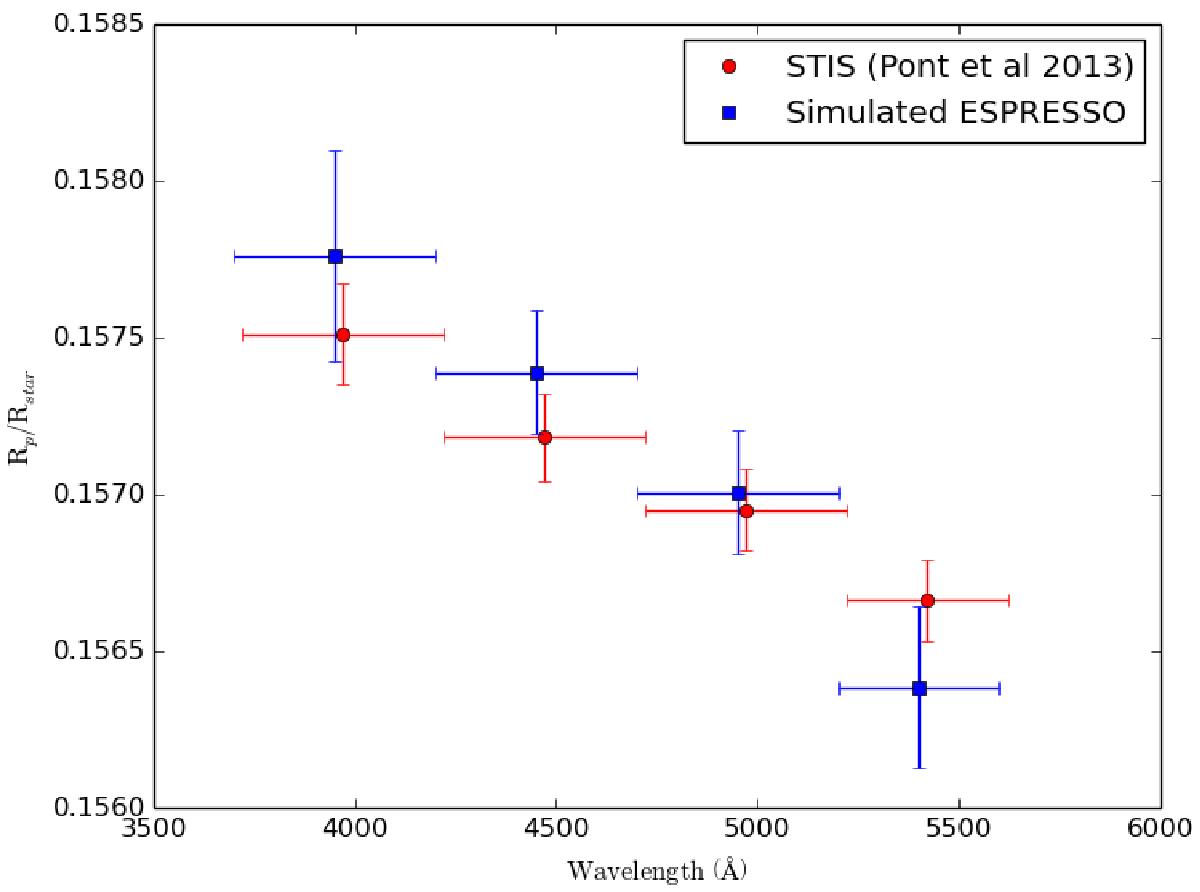
Simulated Rp/Rstar for five transits observed with the future ESPRESSO spectrograph on the VLT (blue squares). Observations of five transits by the STIS spectrograph on HST as presented by Pont et al. (2013) are indicated by red circles. These are shifted slightly redward for clarity. All error bars indicate 1σ uncertainty intervals. These are larger by between 1.5 and 2 times for the ESPRESSO than for the STIS observations.
Current usage metrics show cumulative count of Article Views (full-text article views including HTML views, PDF and ePub downloads, according to the available data) and Abstracts Views on Vision4Press platform.
Data correspond to usage on the plateform after 2015. The current usage metrics is available 48-96 hours after online publication and is updated daily on week days.
Initial download of the metrics may take a while.