Fig. 5
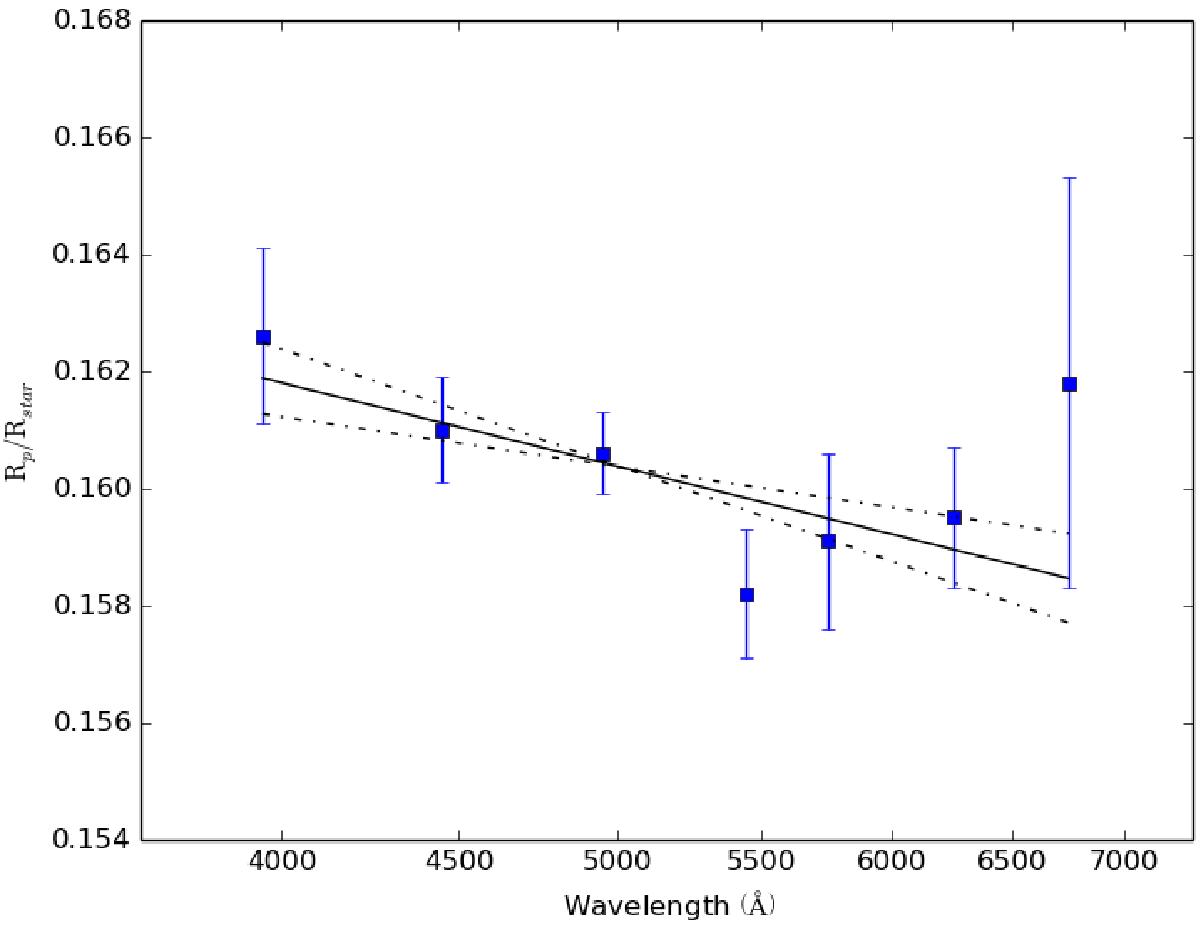
Resulting planet-star radius ratio Rp/Rstar as function of wavelength, indicating the 1σ error bars. The solid line indicates the least-squares fit of a Rayleigh-scattering slope to the data, using Eq. (4). The dashed lines indicate the 1σ error margin on the slope. Note that the abscissae axis is in a logarithmic scale. The linear fit yields a gradient of −0.0064 ± 0.0026 ln[Å]-1, corresponding to a temperature of T = 2300 ± 900 K.
Current usage metrics show cumulative count of Article Views (full-text article views including HTML views, PDF and ePub downloads, according to the available data) and Abstracts Views on Vision4Press platform.
Data correspond to usage on the plateform after 2015. The current usage metrics is available 48-96 hours after online publication and is updated daily on week days.
Initial download of the metrics may take a while.