Free Access
Fig. 4
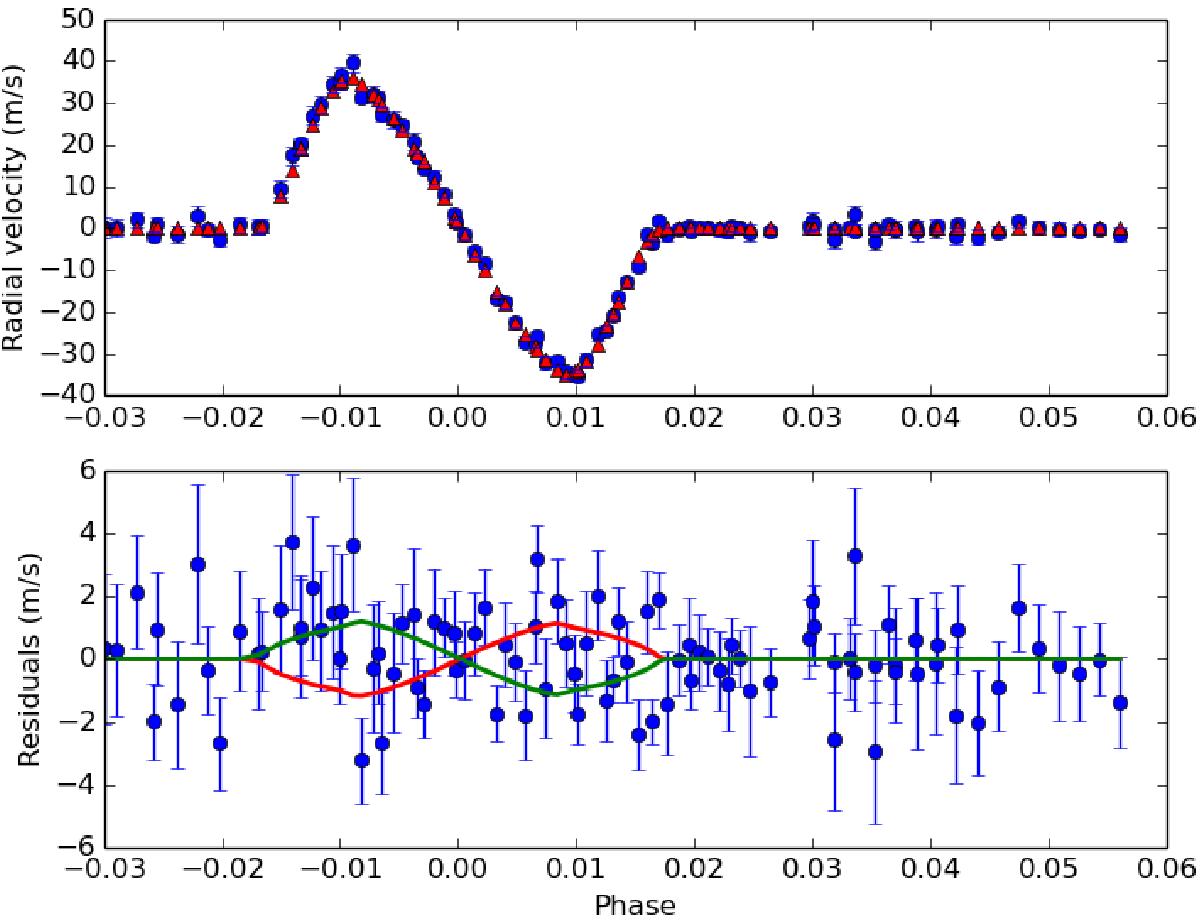
Upper panel: RV time-series for the fifth passband (550–600 nm) and the corresponding best-fit model (blue dots and red line, respectively). Lower panel: residuals to the fit, together with the 5σ upper and lower limit of the Rp/Rstar ratio (solid red and green lines, respectively).
Current usage metrics show cumulative count of Article Views (full-text article views including HTML views, PDF and ePub downloads, according to the available data) and Abstracts Views on Vision4Press platform.
Data correspond to usage on the plateform after 2015. The current usage metrics is available 48-96 hours after online publication and is updated daily on week days.
Initial download of the metrics may take a while.