Free Access
Fig. 1
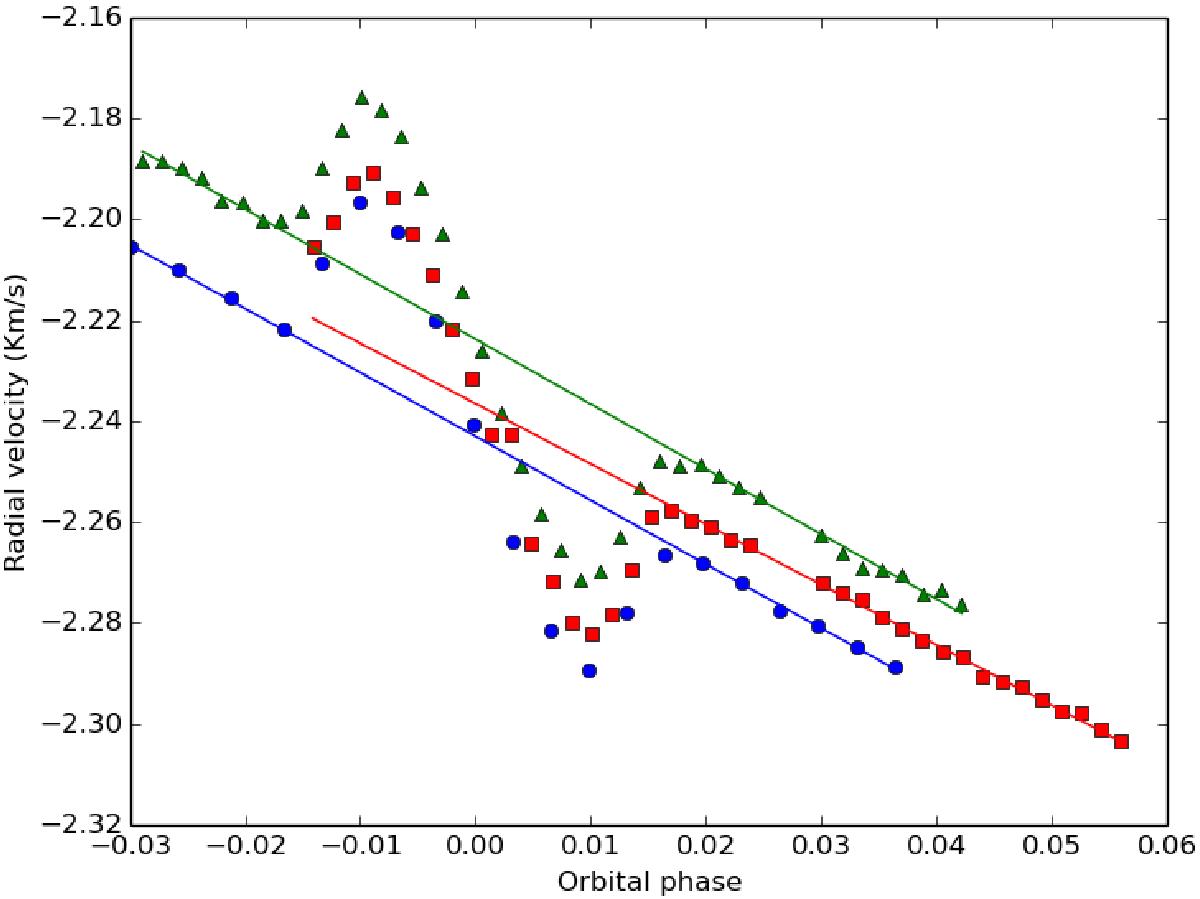
White-light RV time series, plotted as blue dots for the first night, red squares for the second, and green triangles for the third night. The solid lines, with the same colours as used above, are the fitted reflex motion (K) and vsys for each night. These values are shown in Table 3.
Current usage metrics show cumulative count of Article Views (full-text article views including HTML views, PDF and ePub downloads, according to the available data) and Abstracts Views on Vision4Press platform.
Data correspond to usage on the plateform after 2015. The current usage metrics is available 48-96 hours after online publication and is updated daily on week days.
Initial download of the metrics may take a while.