Fig. 5
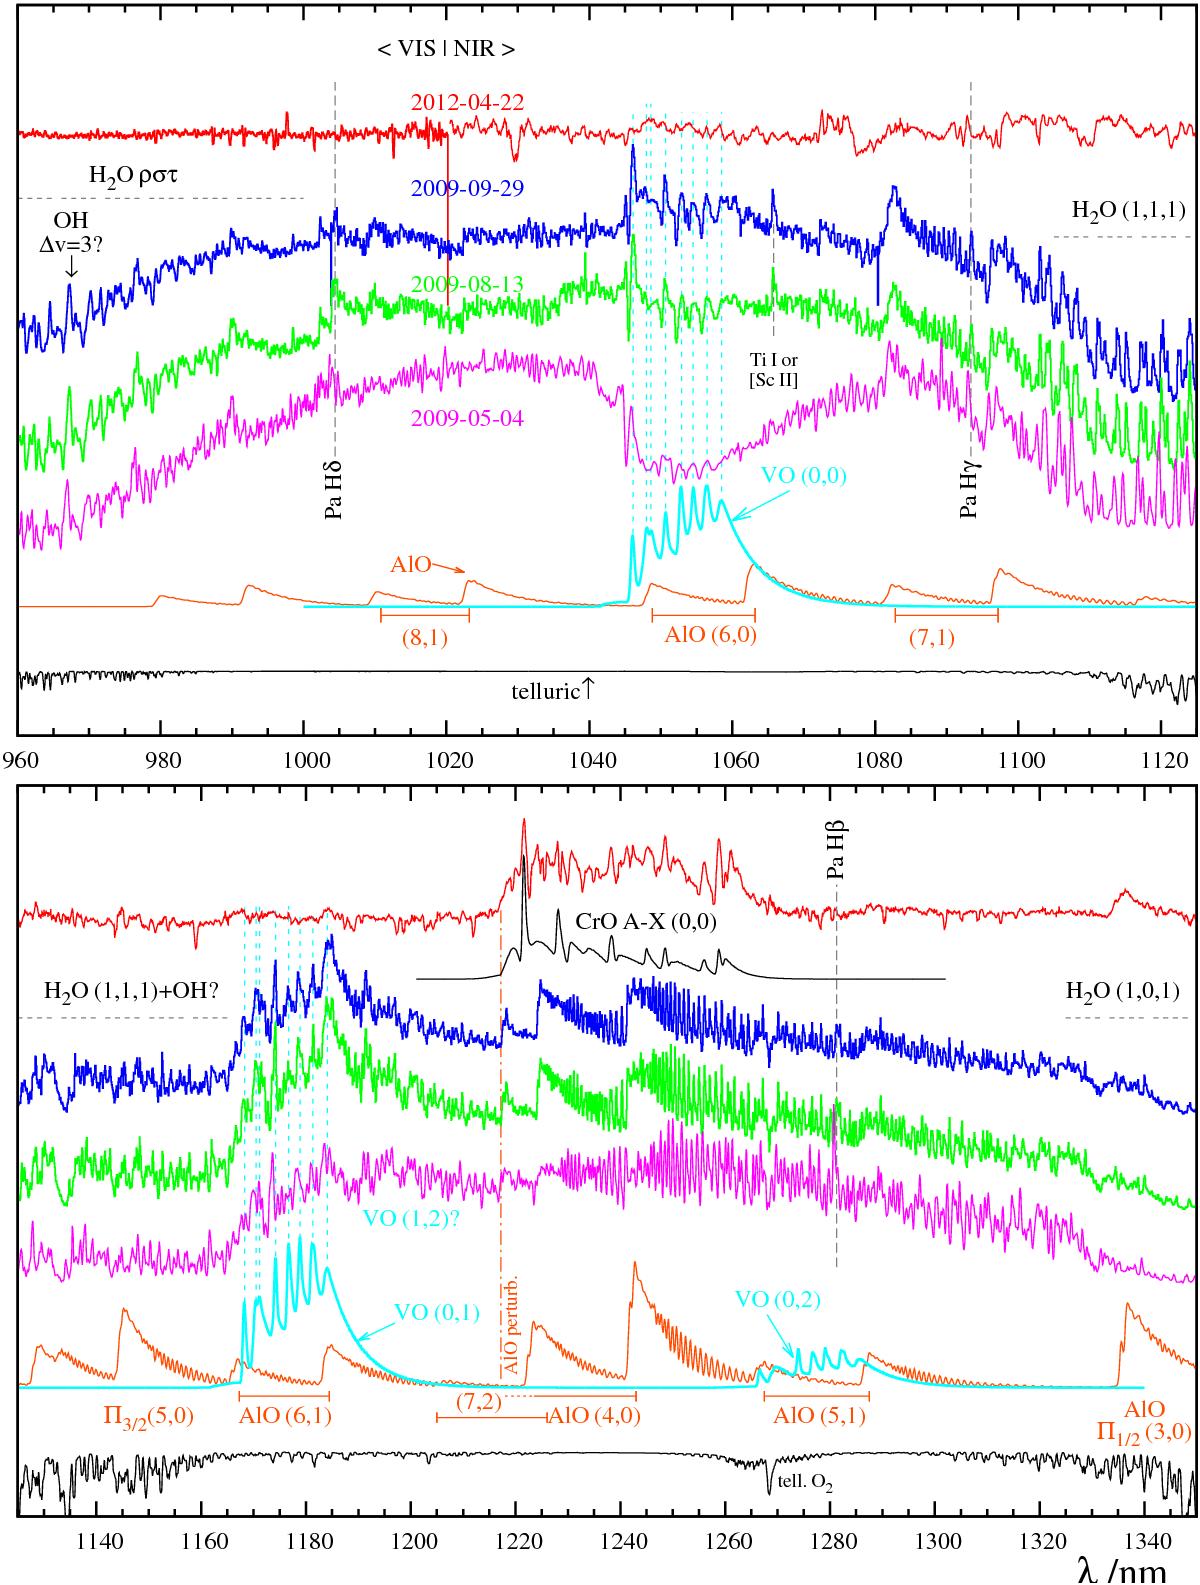
NIR spectra of V1309 Sco covering the JH bands. Simulated spectra of AlO and VO are shown to indicate the location of the emission bands of those species. Location of the water absorption bands is marked with horizontal bars near the edges of the spectral ranges shown. A telluric spectrum is also included at the bottom of the figure (with photospheric absorption features of the standard star). Spectra are in arbitrary units and are not in scale with respect to each other.
Current usage metrics show cumulative count of Article Views (full-text article views including HTML views, PDF and ePub downloads, according to the available data) and Abstracts Views on Vision4Press platform.
Data correspond to usage on the plateform after 2015. The current usage metrics is available 48-96 hours after online publication and is updated daily on week days.
Initial download of the metrics may take a while.