Fig. 3
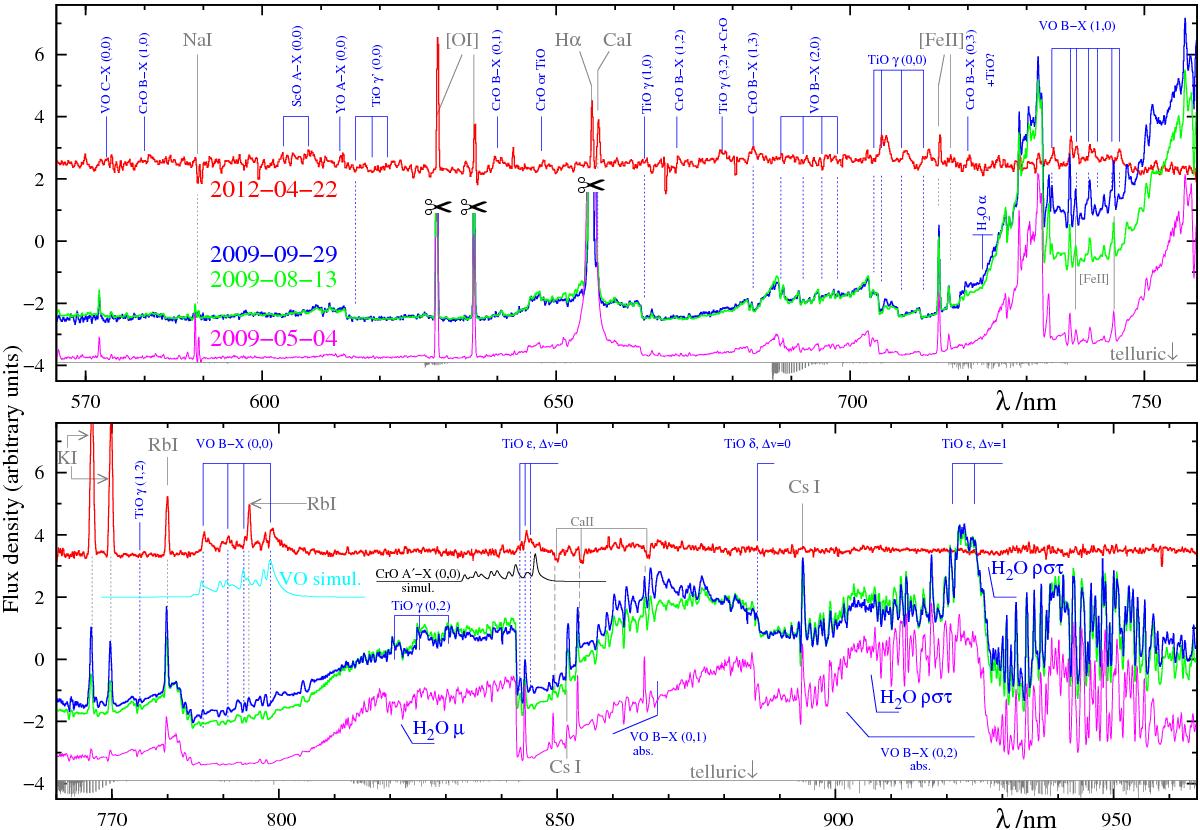
Identification of spectral features in the VIS range. The spectra from May 2009, August 2009, September 2009, and April 2012 are shown with magenta, green, blue, and red lines, respectively. The spectra were corrected for telluric absorption, but location and structure of telluric bands is shown at the bottom part of each panel (grey line). A continuum was subtracted from the 2012 spectrum. All spectra were smoothed and are not in scale with respect to each other. The top parts of the profiles of the Hα and the [O i] lines in the 2009 spectra were clipped for clarity and are marked with the scissors (some profiles are compared separately in Fig. 7). Simulations of the (0, 0) band of the VO B − X and CrO A′ − X systems are shown in the lower panel below the 2012 spectrum (in cyan and black, respectively). They were generated withpgopher at an excitation temperature of 300 K (see Appendix A).
Current usage metrics show cumulative count of Article Views (full-text article views including HTML views, PDF and ePub downloads, according to the available data) and Abstracts Views on Vision4Press platform.
Data correspond to usage on the plateform after 2015. The current usage metrics is available 48-96 hours after online publication and is updated daily on week days.
Initial download of the metrics may take a while.