Free Access
Fig. 5
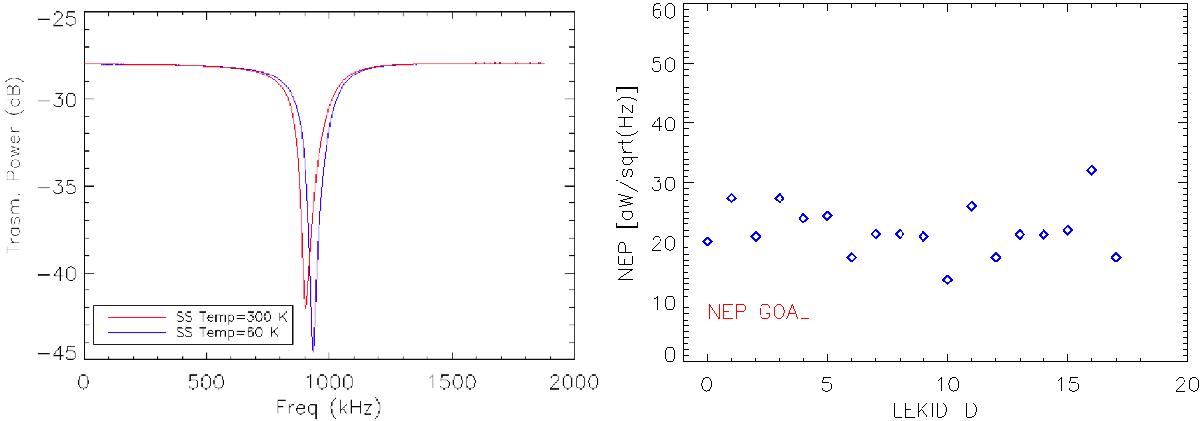
Left: resonant frequency shift that si due to the variation of the SS temperature from 80 K to 300 K. Right: individual pixel sensitivities (blue diamonds) measured during tests compared to the reference goal (dashed red line).
This figure is made of several images, please see below:
Current usage metrics show cumulative count of Article Views (full-text article views including HTML views, PDF and ePub downloads, according to the available data) and Abstracts Views on Vision4Press platform.
Data correspond to usage on the plateform after 2015. The current usage metrics is available 48-96 hours after online publication and is updated daily on week days.
Initial download of the metrics may take a while.