Fig. 9
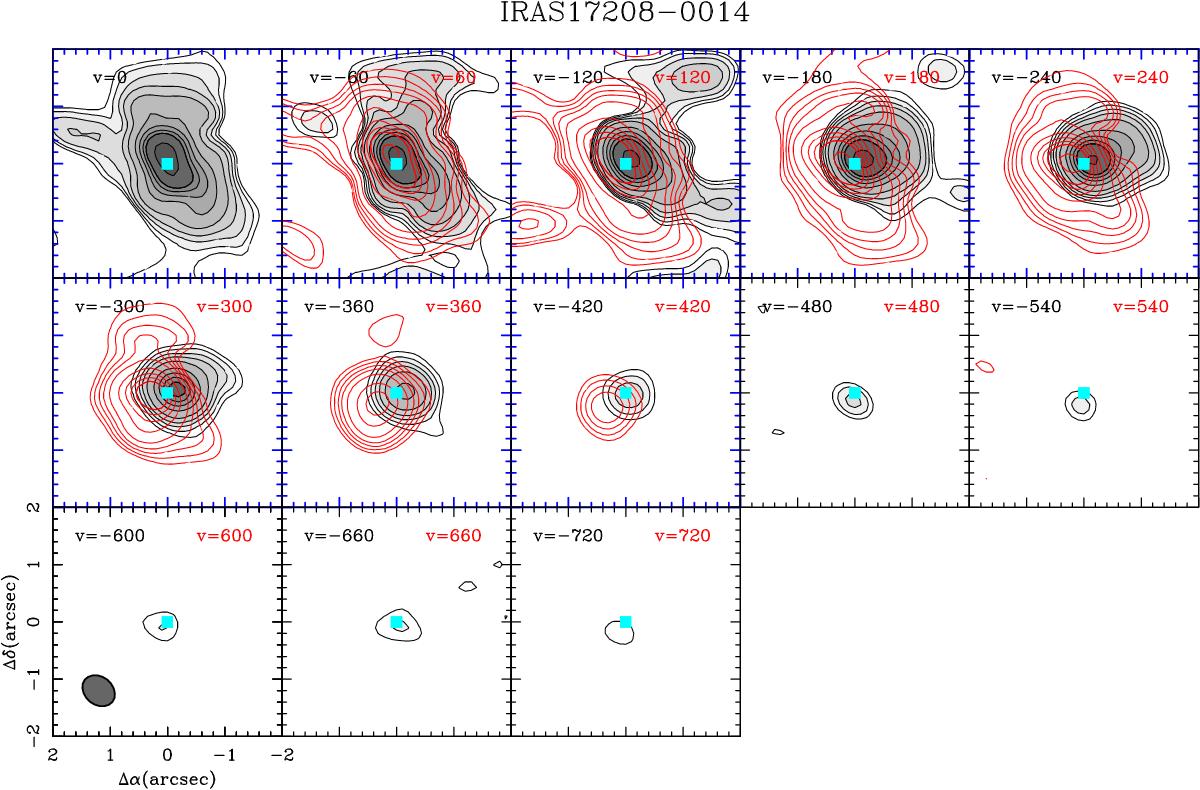
CO(2–1) velocity-channel maps observed with the PdBI in the nucleus of IRAS 17208-0014 with a spatial resolution of ![]() at PA = 61° (beam is plotted as a filled ellipse in the bottom left corner of the lower left panel). Velocity resolution is 60 km s-1. We show a field of view of 4″, i.e., ~1/5 the diameter of the primary beam at 221.1 GHz. We display channel maps grouped by pairs from v − vsys = 0 km s-1 in steps of 60 km s-1 with vsys(HEL) = 12 808 km s-1 from −720 km s-1 to 720 km s-1. Emission at blueshifted velocities is displayed in gray scale and black contours, and emission at redshifted velocities is displayed in red contours. Contour levels are 3σ, 5σ, and 8σ with 1σ = 0.7 mJy beam-1 for the channels of the line wing (|v − vsys| ≥ 450 km s-1), and 3σ, 5σ, 8σ, 12σ, 20σ, to 100σ in steps of 20σ, and 160σ with 1σ = 1.4 mJy beam-1 for the channels of the line core (|v − vsys|< 450 km s-1; boxes highlighted in blue). The position of the dynamical center ([Δα, Δδ] = [0″, 0″] = [α2000 = 17h23m21.96s, δ2000 = −00°17′00.87″]) is highlighted by the (blue) square marker.
at PA = 61° (beam is plotted as a filled ellipse in the bottom left corner of the lower left panel). Velocity resolution is 60 km s-1. We show a field of view of 4″, i.e., ~1/5 the diameter of the primary beam at 221.1 GHz. We display channel maps grouped by pairs from v − vsys = 0 km s-1 in steps of 60 km s-1 with vsys(HEL) = 12 808 km s-1 from −720 km s-1 to 720 km s-1. Emission at blueshifted velocities is displayed in gray scale and black contours, and emission at redshifted velocities is displayed in red contours. Contour levels are 3σ, 5σ, and 8σ with 1σ = 0.7 mJy beam-1 for the channels of the line wing (|v − vsys| ≥ 450 km s-1), and 3σ, 5σ, 8σ, 12σ, 20σ, to 100σ in steps of 20σ, and 160σ with 1σ = 1.4 mJy beam-1 for the channels of the line core (|v − vsys|< 450 km s-1; boxes highlighted in blue). The position of the dynamical center ([Δα, Δδ] = [0″, 0″] = [α2000 = 17h23m21.96s, δ2000 = −00°17′00.87″]) is highlighted by the (blue) square marker.
Current usage metrics show cumulative count of Article Views (full-text article views including HTML views, PDF and ePub downloads, according to the available data) and Abstracts Views on Vision4Press platform.
Data correspond to usage on the plateform after 2015. The current usage metrics is available 48-96 hours after online publication and is updated daily on week days.
Initial download of the metrics may take a while.