Fig. 7
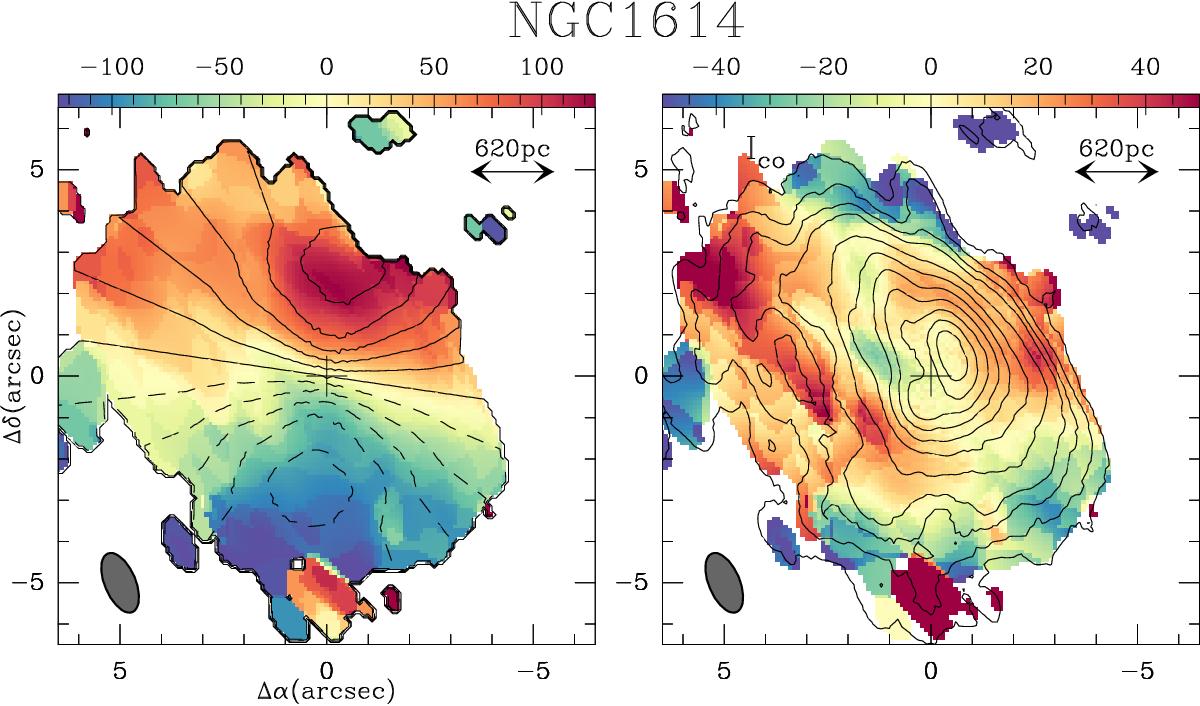
Left panel: overlay of the velocity field of the best-fit rotating disk model (in contours spanning the range −100 km s-1 to 100 km s-1 in steps of 20 km s-1) on the CO(1–0) isovelocities (color scale as shown) of NGC 1614. Right panel: overlay of the CO(1–0) intensity contours (levels as in the left-hand panel of Fig. 4) on the residual mean-velocity field (in color scale as shown) obtained after subtraction of the best-fit rotating disk model from the observations.
Current usage metrics show cumulative count of Article Views (full-text article views including HTML views, PDF and ePub downloads, according to the available data) and Abstracts Views on Vision4Press platform.
Data correspond to usage on the plateform after 2015. The current usage metrics is available 48-96 hours after online publication and is updated daily on week days.
Initial download of the metrics may take a while.