Fig. 5
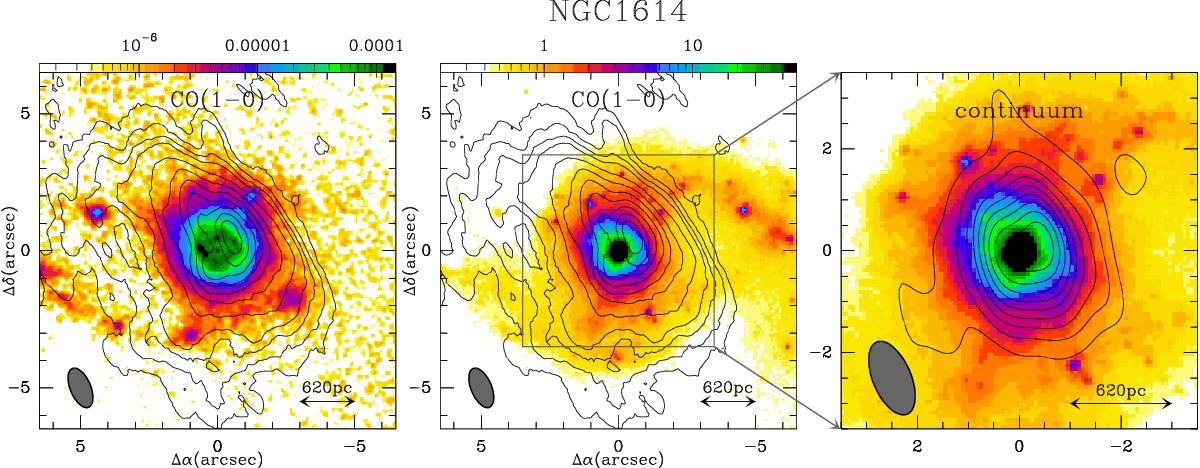
Left panel: overlay of the CO(1–0) intensity contours (levels as in the left-hand panel of Fig. 4) on the Paα emission HST map of NGC 1614 (color scale as shown in arbitrary units). Middle panel: same as left panel but with CO contours overlaid on the HST/NICMOS 1.6 μm continuum image (color scale as shown in arbitrary units). Right panel: same as middle panel but zooming in on the continuum emission image of NGC 1614 at 113.5 GHz, in contours (10% to 90% in steps of 10% of the peak value = 2.4 mJy beam-1~24σ), overlaid on the HST NICMOS image. The filled ellipses represent the CO beam size.
Current usage metrics show cumulative count of Article Views (full-text article views including HTML views, PDF and ePub downloads, according to the available data) and Abstracts Views on Vision4Press platform.
Data correspond to usage on the plateform after 2015. The current usage metrics is available 48-96 hours after online publication and is updated daily on week days.
Initial download of the metrics may take a while.