Fig. 4
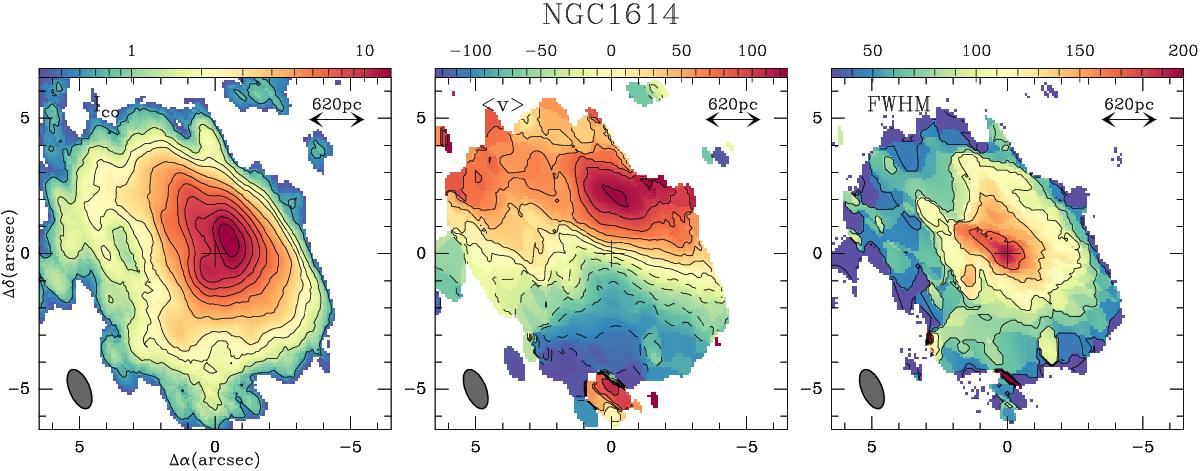
Left panel: CO(1–0) integrated intensity map obtained in the disk of NGC 1614. The map is shown on color scale with contour levels 5%, 10%, 15%, 20%, to 90% in steps of 10% of the peak value =14 Jy km s-1beam-1 (~50σ). Middle panel: the CO(1–0) isovelocity contours spanning the range (−120 km s-1, 120 km s-1) in steps of 20 km s-1 are overlaid on a false-color velocity map (linear color scale as shown). Velocities refer to vsys(HEL) = 4763 km s-1. Right panel: overlay of the CO(1–0) line widths (FWHM) shown in contours (30, 45 to 195 km s-1 in steps of 30 km s-1) on a false-color width map (linear scale as shown). The filled ellipses in the bottom left corner of each panel represent the CO(1−0) beam size obtained with uniform weighting (![]() at PA = 23°). The position of the dynamical center is highlighted by the cross marker.
at PA = 23°). The position of the dynamical center is highlighted by the cross marker.
Current usage metrics show cumulative count of Article Views (full-text article views including HTML views, PDF and ePub downloads, according to the available data) and Abstracts Views on Vision4Press platform.
Data correspond to usage on the plateform after 2015. The current usage metrics is available 48-96 hours after online publication and is updated daily on week days.
Initial download of the metrics may take a while.