Fig. 3
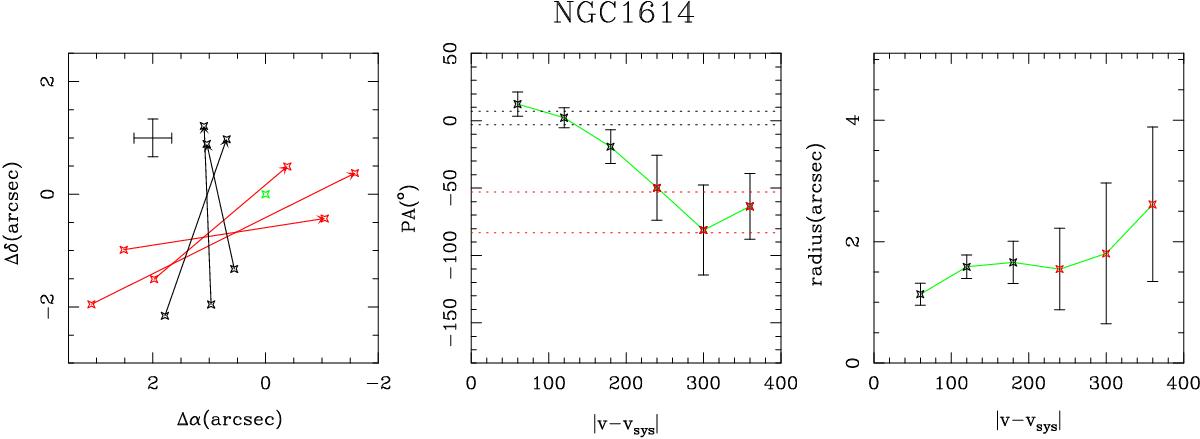
Centroids of CO(1–0) emission in NGC 1614 (in [Δα, Δδ]-units) derived with a velocity resolution of 60 km s-1, using a power law of the flux as weighting function with index n = 1/2, are displayed in the left panel . Emission centroids calculated for velocity channels that are equidistant from vsys (i.e., with a common |v − vsys|–offset) are connected to visualize the change of PA, defined for the redshifted component of the connected centroids and measured east from north, as a function of velocity (middle panel). We also plot the change in the average radius r, defined as half of the mutual distance from the connected centroids, as a function of velocity (right panel). Red color is used for velocity channels of the line wing and black color for the line core. The dotted black (red) line in the middle panel identifies the ±1σ range around the average PA of the disk as derived inside the line core (line wing): PAcore = 2 ± 5° (PAwing = −68 ± 15°). The green marker in the left panel identifies the dynamical center. Error bars as a function of velocity channel are shown in the middle and right panels. Error bars in the left panel are for the line core.
Current usage metrics show cumulative count of Article Views (full-text article views including HTML views, PDF and ePub downloads, according to the available data) and Abstracts Views on Vision4Press platform.
Data correspond to usage on the plateform after 2015. The current usage metrics is available 48-96 hours after online publication and is updated daily on week days.
Initial download of the metrics may take a while.