Fig. 20
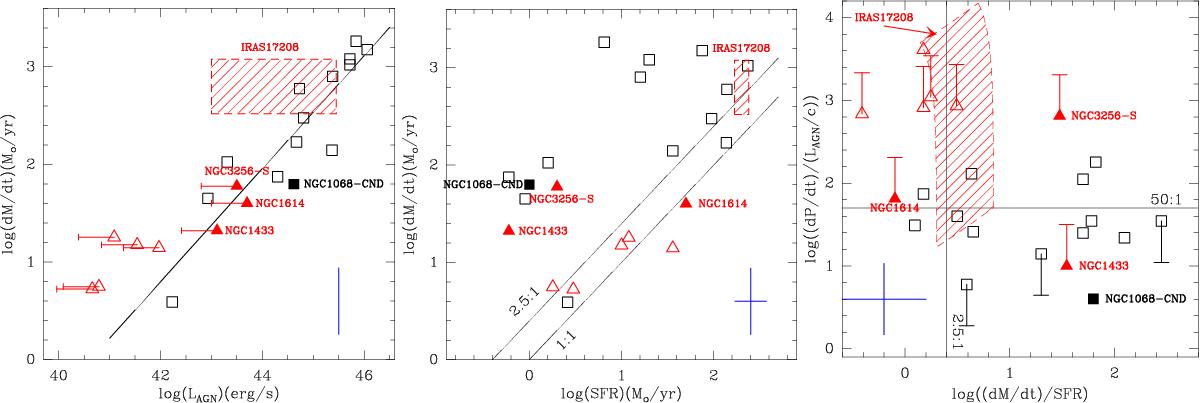
Scaling relations derived for the molecular outflows observed in the sample of galaxies compiled for this work: outflow mass-loss rate as a function of the AGN bolometric luminosity (left panel), outflow mass-loss rate as a function of the SFR (middle panel), and momentum boost factor as a function of mass-loading factor (right panel). Open symbols identify galaxies from the sample of Cicone et al. (2014). Open (red) triangles show the data from pure starburst galaxies; open (black) squares identify the data of low and high-luminosity AGNs, where the presence of an AGN has been securely detected. Filled symbols identify the data from the new additions discussed in Sect 6: NGC 1433 (Combes et al. 2013), the CND of NGC 1068 ≡ NGC 1068-CND (García-Burillo et al. 2014), the southern nucleus of NGC 3256 ≡ NGC 3256-S (Sakamoto et al. 2014; Emonts et al. 2014), as well as NGC 1614 and IRAS 17208-0014 (this work). The hashed polygons show the allowed range of values for IRAS 17208-0014 in all the panels. The line in the left panel shows the linear fit to the AGN sample. Lines in the middle and right panels illustrate different values of the mass and momentum loading factors. One-sided errorbars identify upper and lower limits on the values plotted in all the panels. In the bottom right of the left and middle panels and in the bottom left of the right panel we show 1σ errorbars that are representative of the whole sample used in this work (see discussion in Sect. 5.3 and Cicone et al. 2014).
Current usage metrics show cumulative count of Article Views (full-text article views including HTML views, PDF and ePub downloads, according to the available data) and Abstracts Views on Vision4Press platform.
Data correspond to usage on the plateform after 2015. The current usage metrics is available 48-96 hours after online publication and is updated daily on week days.
Initial download of the metrics may take a while.