Fig. 2
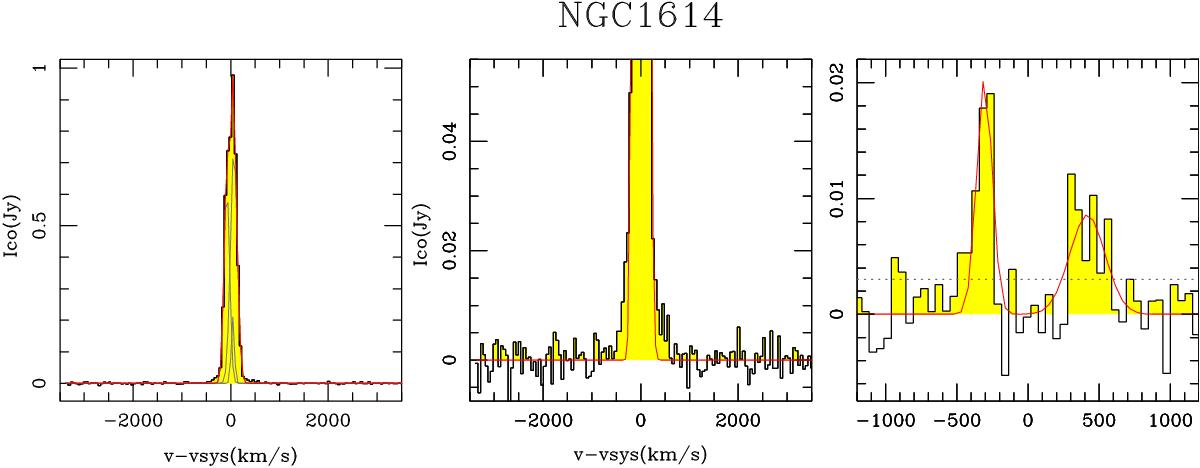
CO(1–0) spectrum obtained by spatially integrating the emission over the disk of NGC 1614. We show the three individual Gaussian components fitted to the spectrum (gray curves) and the implied overall fit combining them (red curve) (left panel). A close-up view of the overall fit to the spectrum is shown in the middle panel to highlight emission from the line wings. Residuals and associated Gaussian fits are shown in the right panel with the typical 1σ level indicated by the dotted line.
Current usage metrics show cumulative count of Article Views (full-text article views including HTML views, PDF and ePub downloads, according to the available data) and Abstracts Views on Vision4Press platform.
Data correspond to usage on the plateform after 2015. The current usage metrics is available 48-96 hours after online publication and is updated daily on week days.
Initial download of the metrics may take a while.