Free Access
Fig. 19
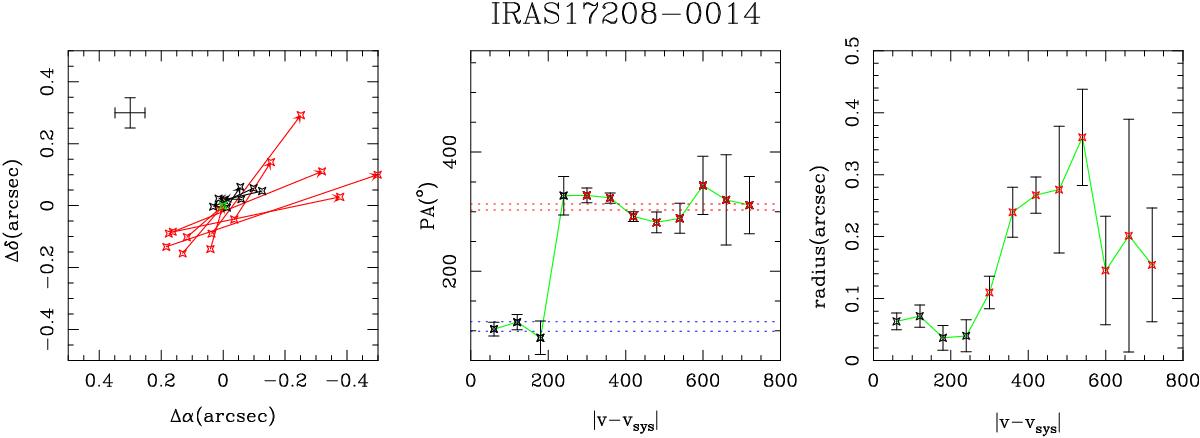
Same as Fig. 11 but for the centroids of CO(2–1) emission in IRAS 17208-0014 derived from the data cube after subtraction of the rotation curve. Red is used for velocity channels of the line wings as redefined in Sect. 5.4. Black is used for the line core.
Current usage metrics show cumulative count of Article Views (full-text article views including HTML views, PDF and ePub downloads, according to the available data) and Abstracts Views on Vision4Press platform.
Data correspond to usage on the plateform after 2015. The current usage metrics is available 48-96 hours after online publication and is updated daily on week days.
Initial download of the metrics may take a while.