Fig. 17
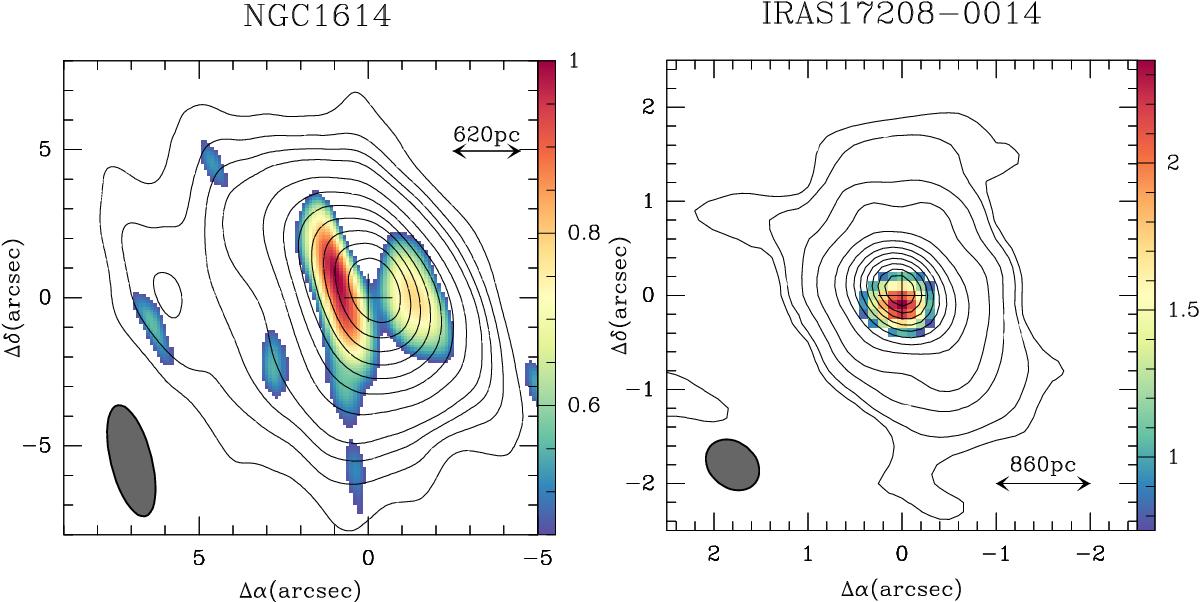
Left panel: overlay of the CO(1–0) intensity contours of the disk of NGC 1614, obtained by integrating the emission of the NA weighting dataset inside the line core, on the intensity map of the molecular outflow (in color), obtained by integrating the emission inside the line wing region. The two velocity intervals are defined in Sect. 4.1. Color scale spans the range [5σ, 11σ], and contour levels are: 5%, 10%, 15%, 20%, to 90% in steps of 10% of the peak value = 38 Jy km s-1 beam-1. Right panel: same as left panel but obtained from the UN weighting dataset of IRAS 17208-0014. The color scale spans the range [5σ, 15σ], and contour levels are 1%, 2%, 5%, 10%, to 90% in steps of 10% of the peak value = 127 Jy km s-1 beam-1. The two velocity intervals are defined in Sect. 4.4.
Current usage metrics show cumulative count of Article Views (full-text article views including HTML views, PDF and ePub downloads, according to the available data) and Abstracts Views on Vision4Press platform.
Data correspond to usage on the plateform after 2015. The current usage metrics is available 48-96 hours after online publication and is updated daily on week days.
Initial download of the metrics may take a while.