Fig. 16
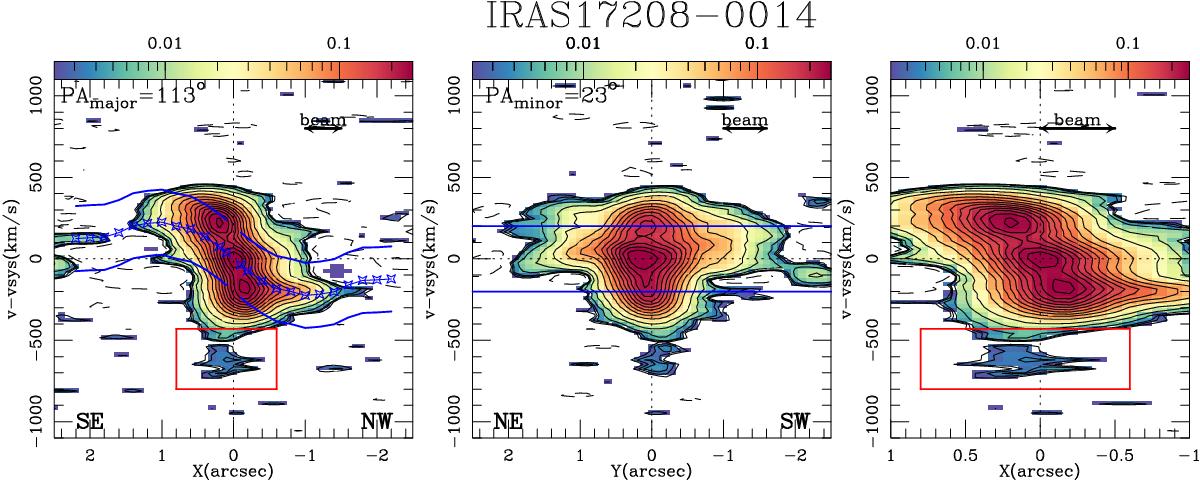
Left panel: the (p-v) plot taken along the kinematic major axis (PA = 113°) of IRAS 17208-0014. As in Fig. 8, we delineate the (projected) rotation curve and the allowed virial range around it. Similarly, we delimit the region where emission is detected from the line wing. Middle panel: the p-v plot taken along the kinematic minor axis (PA = 23°). As in Fig. 8, the allowed virial range is delimited by the blue curves. Right panel: same as left panel but zooming in on the central ±1″ region around the center. In all panels, contour levels are −2σ, 2σ, 2.5σ, 3σ, 5σ, 10σ, 20σ, to 220σ in steps of 20σ with 1σ = 1.2 mJy beam-1. The velocity scale is relative to vsys. The spatial scales (X and Y) are relative to the dynamical center. We highlight the spatial resolution (beam size) achieved with UN weighting in each panel.
Current usage metrics show cumulative count of Article Views (full-text article views including HTML views, PDF and ePub downloads, according to the available data) and Abstracts Views on Vision4Press platform.
Data correspond to usage on the plateform after 2015. The current usage metrics is available 48-96 hours after online publication and is updated daily on week days.
Initial download of the metrics may take a while.