Fig. 15
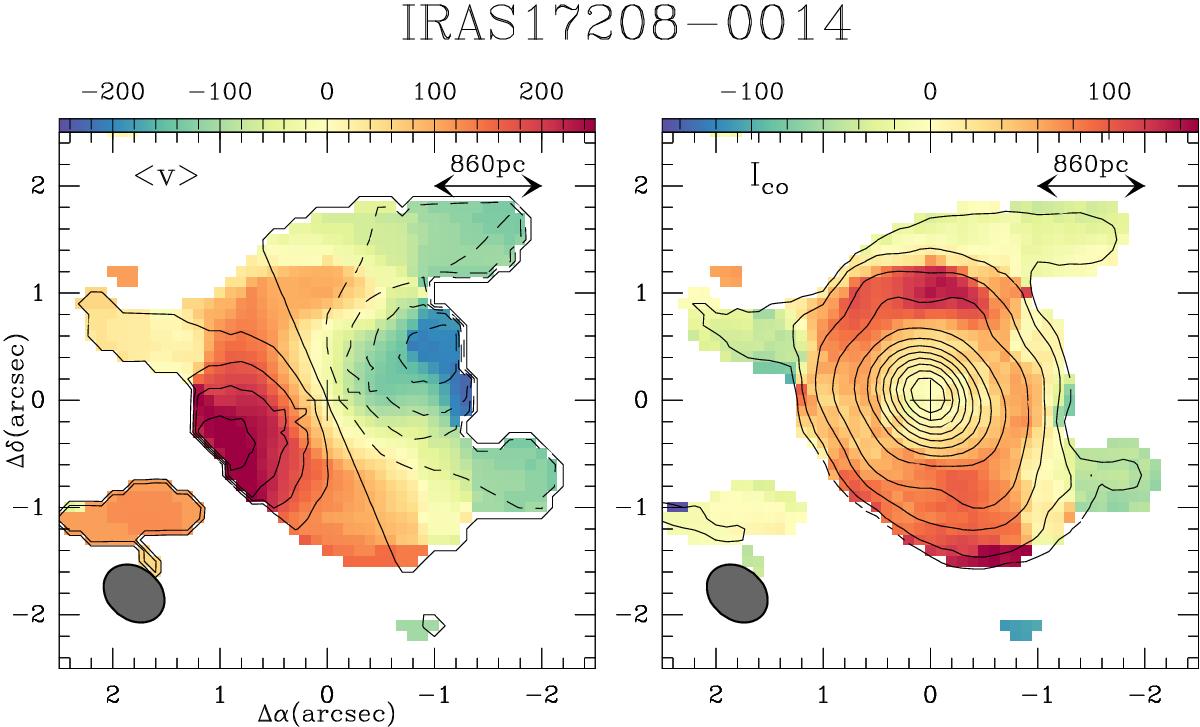
Same as Fig. 7, but showing here the comparison between the CO(2–1) observations and the best-fit model in IRAS 17208-0014. Contours in the left panel span the range –200 km s-1 to 200 km s-1 in steps of 50 km s-1. The CO(2–1) intensity contours in the right panel are as in the left-hand panel of Fig. 12. Color scales in both panels are as shown.
Current usage metrics show cumulative count of Article Views (full-text article views including HTML views, PDF and ePub downloads, according to the available data) and Abstracts Views on Vision4Press platform.
Data correspond to usage on the plateform after 2015. The current usage metrics is available 48-96 hours after online publication and is updated daily on week days.
Initial download of the metrics may take a while.