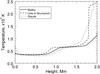
Fig. 2
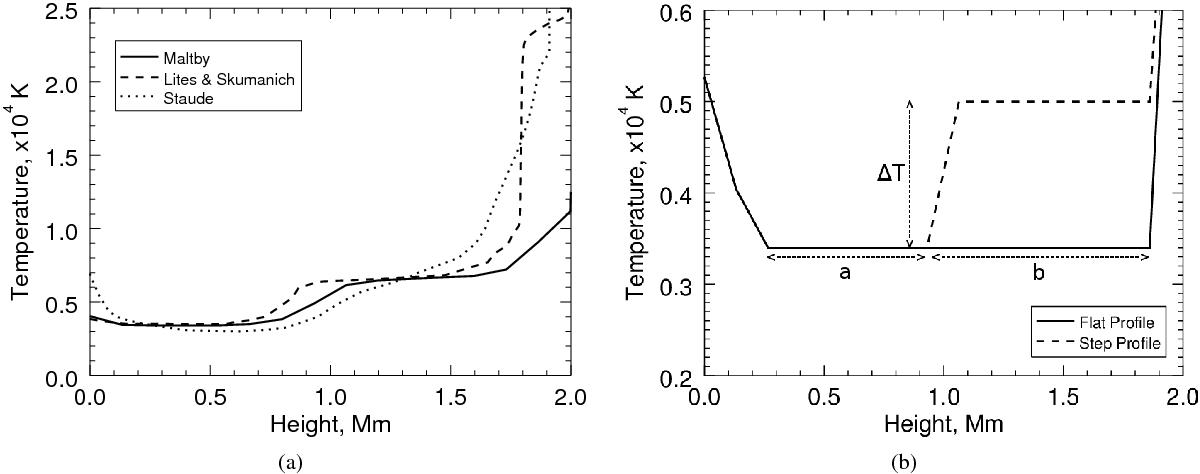
Chromospheric temperature profiles. a) Different theoretical temperature profiles for the chromosphere above a sunspot: solid line from Maltby et al. (1986), dashed line from Lites & Skumanich (1982), and dotted line from Staude (1981). b) Flat and step chromospheric temperature profiles with the photosphere at 0 and the transition region at 1.8 Mm. This chromospheric profile is shown in relation to the photospheric and coronal temperature profiles in Fig. 1. The step profile is a simplification of the theoretical temperature models shown in Fig. 2a.
Current usage metrics show cumulative count of Article Views (full-text article views including HTML views, PDF and ePub downloads, according to the available data) and Abstracts Views on Vision4Press platform.
Data correspond to usage on the plateform after 2015. The current usage metrics is available 48-96 hours after online publication and is updated daily on week days.
Initial download of the metrics may take a while.