Fig. 11
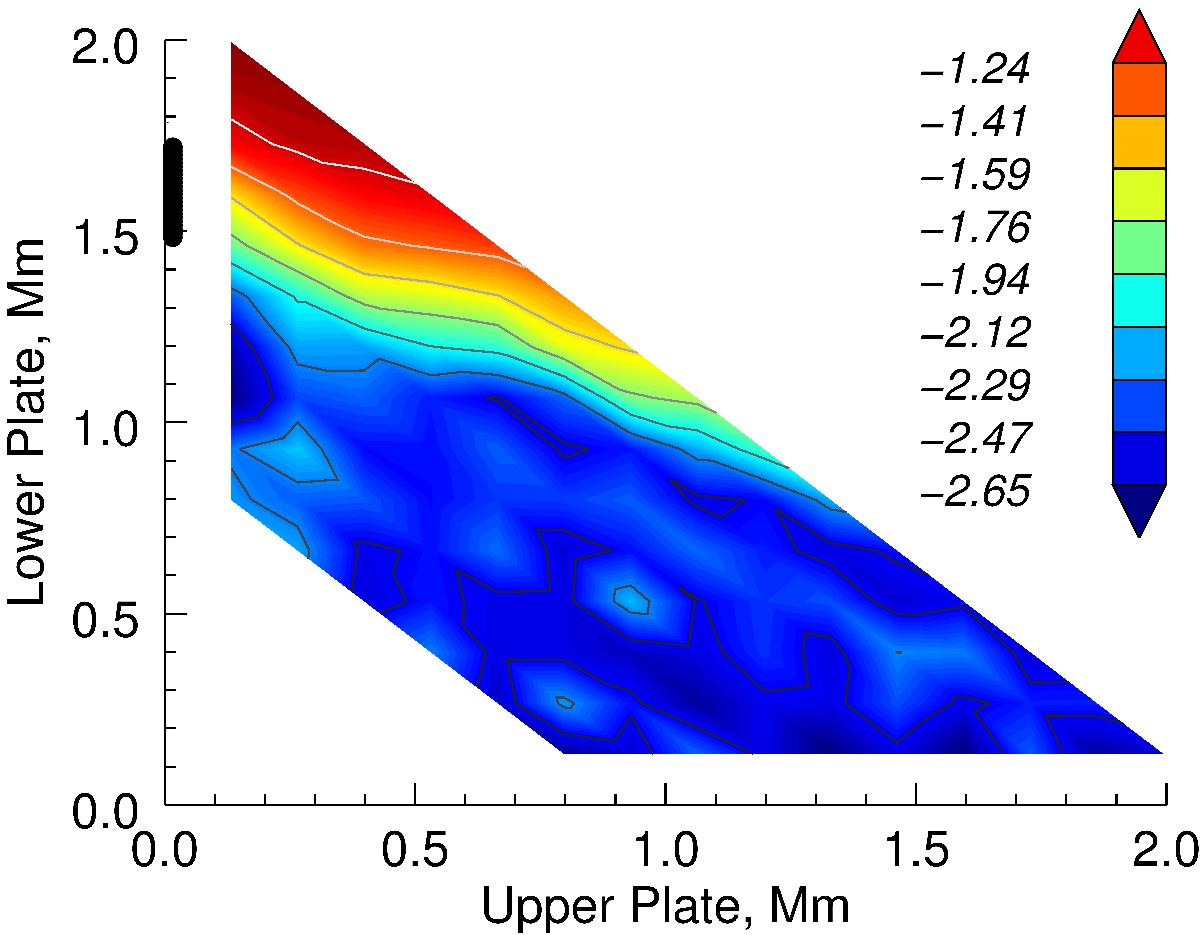
Contours of the gradient in the obtained coronal spectra (region III of Fig. 8) generated by white noise and the step temperature profile. The lower plateau sizes are given by values of a and the upper plateau sizes by b in Fig. 2b. The black marker on the vertical axis indicates the steep gradient change for the flat profile, as seen in Fig. 10b.
Current usage metrics show cumulative count of Article Views (full-text article views including HTML views, PDF and ePub downloads, according to the available data) and Abstracts Views on Vision4Press platform.
Data correspond to usage on the plateform after 2015. The current usage metrics is available 48-96 hours after online publication and is updated daily on week days.
Initial download of the metrics may take a while.