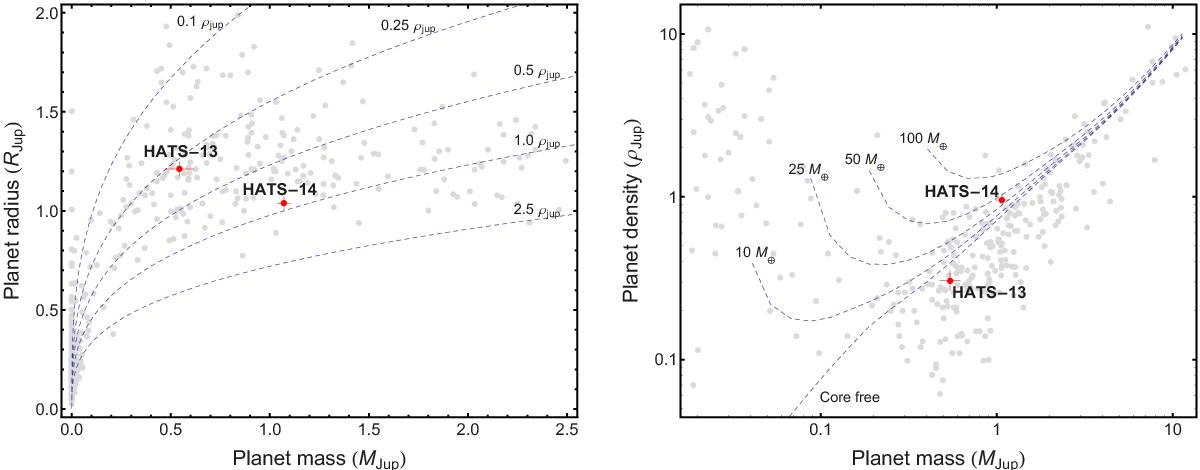
Fig. 6

Left panel: masses and radii of the known transiting extrasolar planets. The grey points denote values taken from TEPCat. Their error bars have been suppressed for clarity. HATS-13b and HATS-14b are shown in red points with error bars. Dotted lines show where density is 2.5, 1.0, 0.5, 0.25 and 0.1 ρJ. Right panel: the mass-density diagram of the currently known transiting exoplanets (taken from TEPCat). Again HATS-13b and HATS-14b are shown in red points with error bars. Four planetary models with various core masses (10, 25, 50, and 100 Earth mass) and another without a core (Fortney et al. 2007) are plotted for comparison.
Current usage metrics show cumulative count of Article Views (full-text article views including HTML views, PDF and ePub downloads, according to the available data) and Abstracts Views on Vision4Press platform.
Data correspond to usage on the plateform after 2015. The current usage metrics is available 48-96 hours after online publication and is updated daily on week days.
Initial download of the metrics may take a while.


