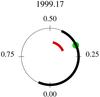
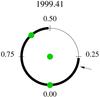
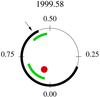
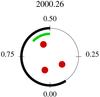
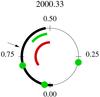
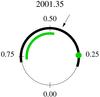
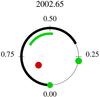
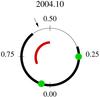
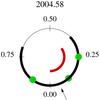
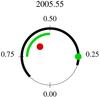
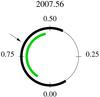
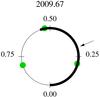
Fig. 7
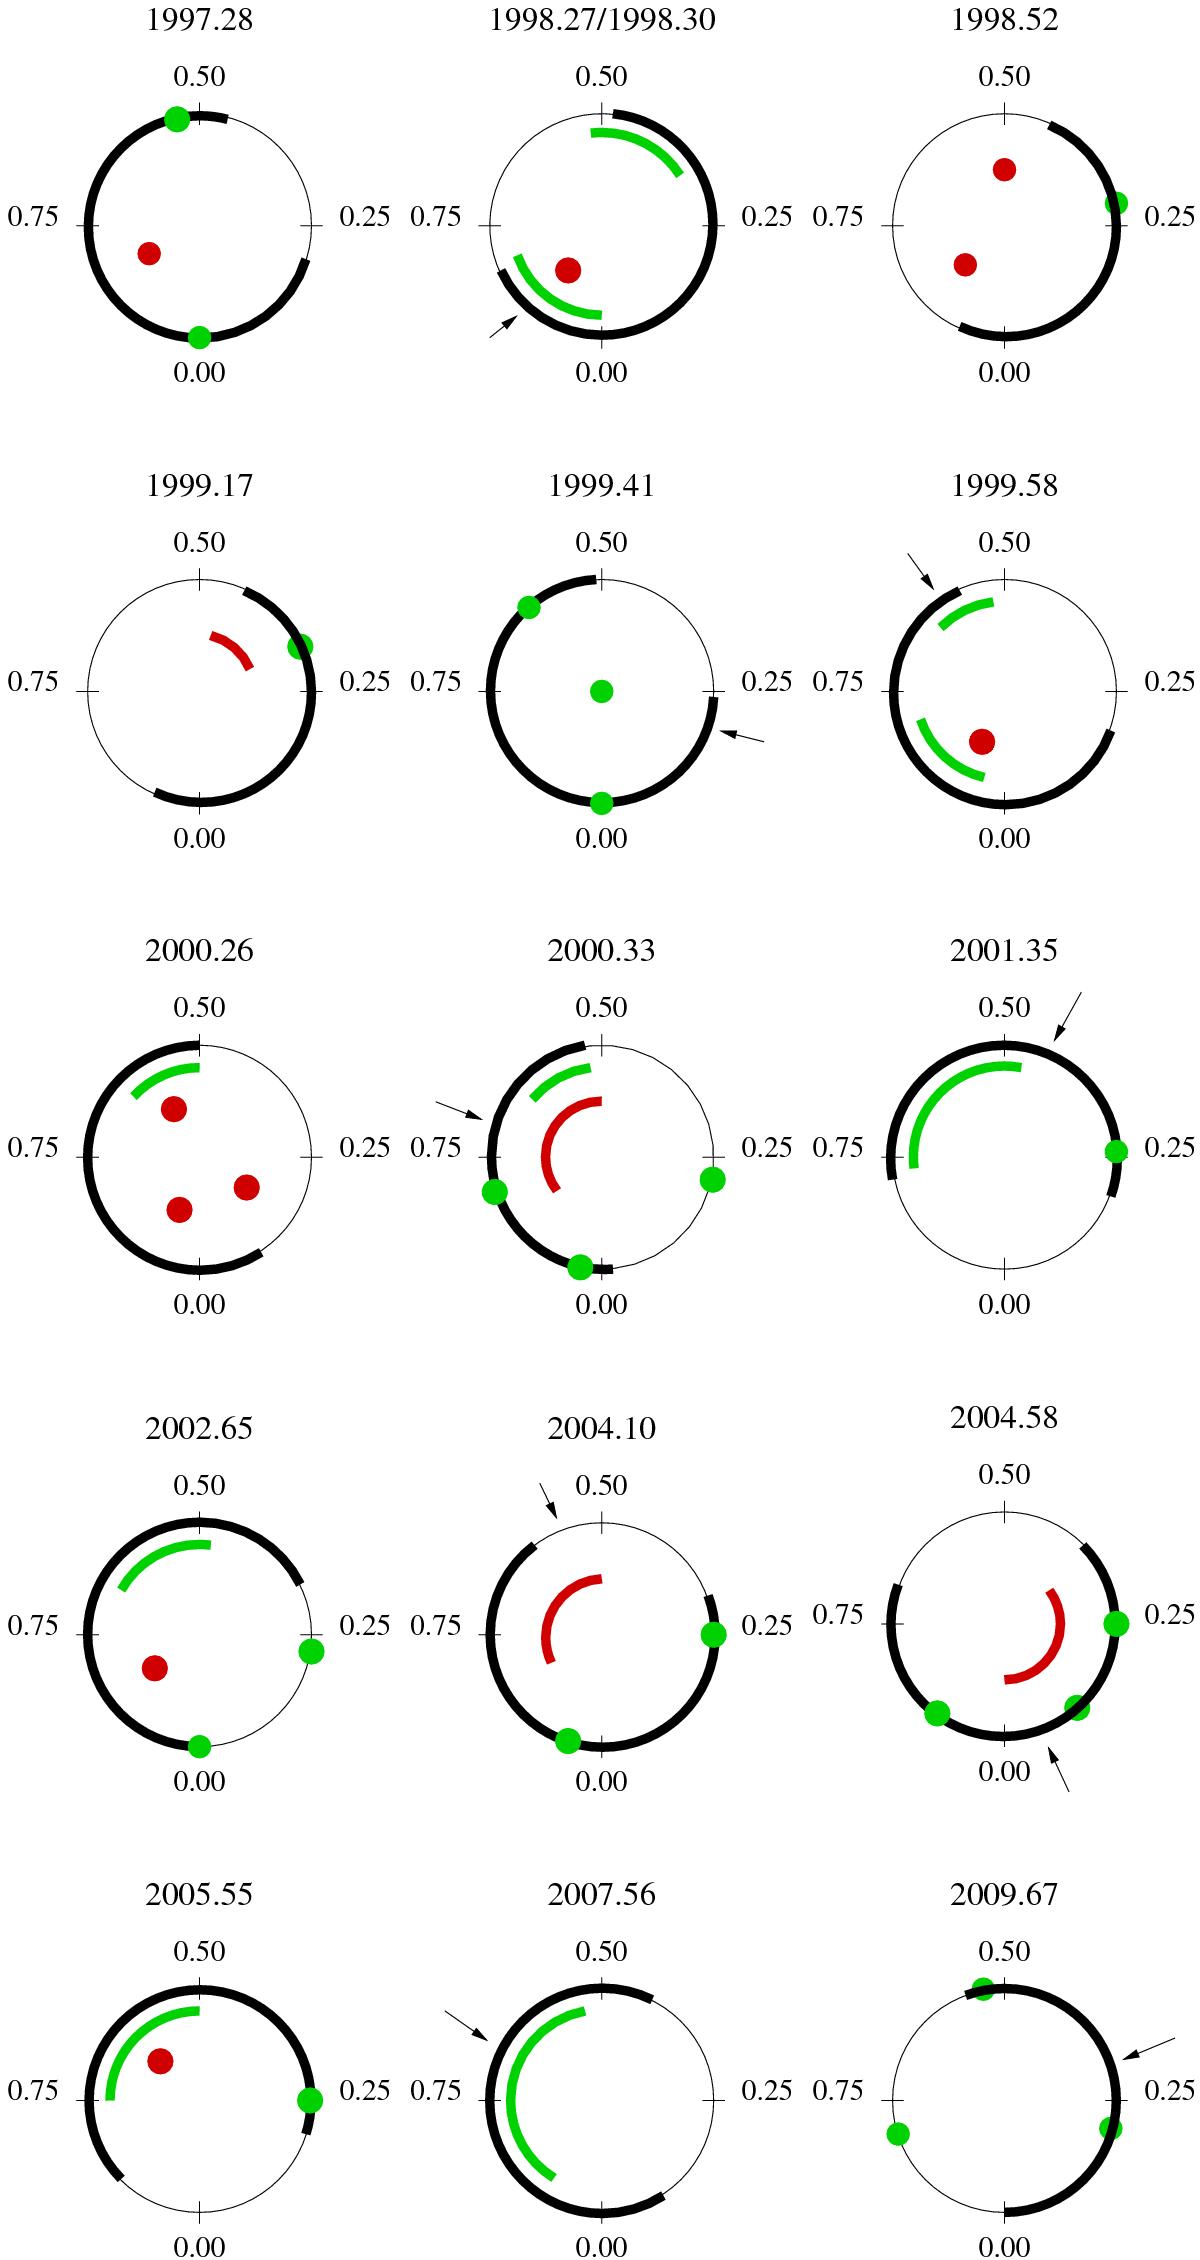
Possible connection between the dark photospheric spots and the chromospheric features. The approximate locations of starspots from light curve inversion (Korhonen et al. 2002) and from this paper (see Fig. 6) are indicated with black arcs. Stronger spots from Doppler images in Korhonen et al. (2007) and from this paper (see Fig. 5) are shown with green dots or arcs, and green dots in the middle of the circles indicate polar caps. Phases of prominences (see Fig. 2), i.e., when the prominences cross the stellar disk, are shown with black arrows outside the circles. Phases of increased Hα emission seen in Fig. 2 are labelled with red dots/arcs inside the circles.
Current usage metrics show cumulative count of Article Views (full-text article views including HTML views, PDF and ePub downloads, according to the available data) and Abstracts Views on Vision4Press platform.
Data correspond to usage on the plateform after 2015. The current usage metrics is available 48-96 hours after online publication and is updated daily on week days.
Initial download of the metrics may take a while.