Free Access
Fig. 4
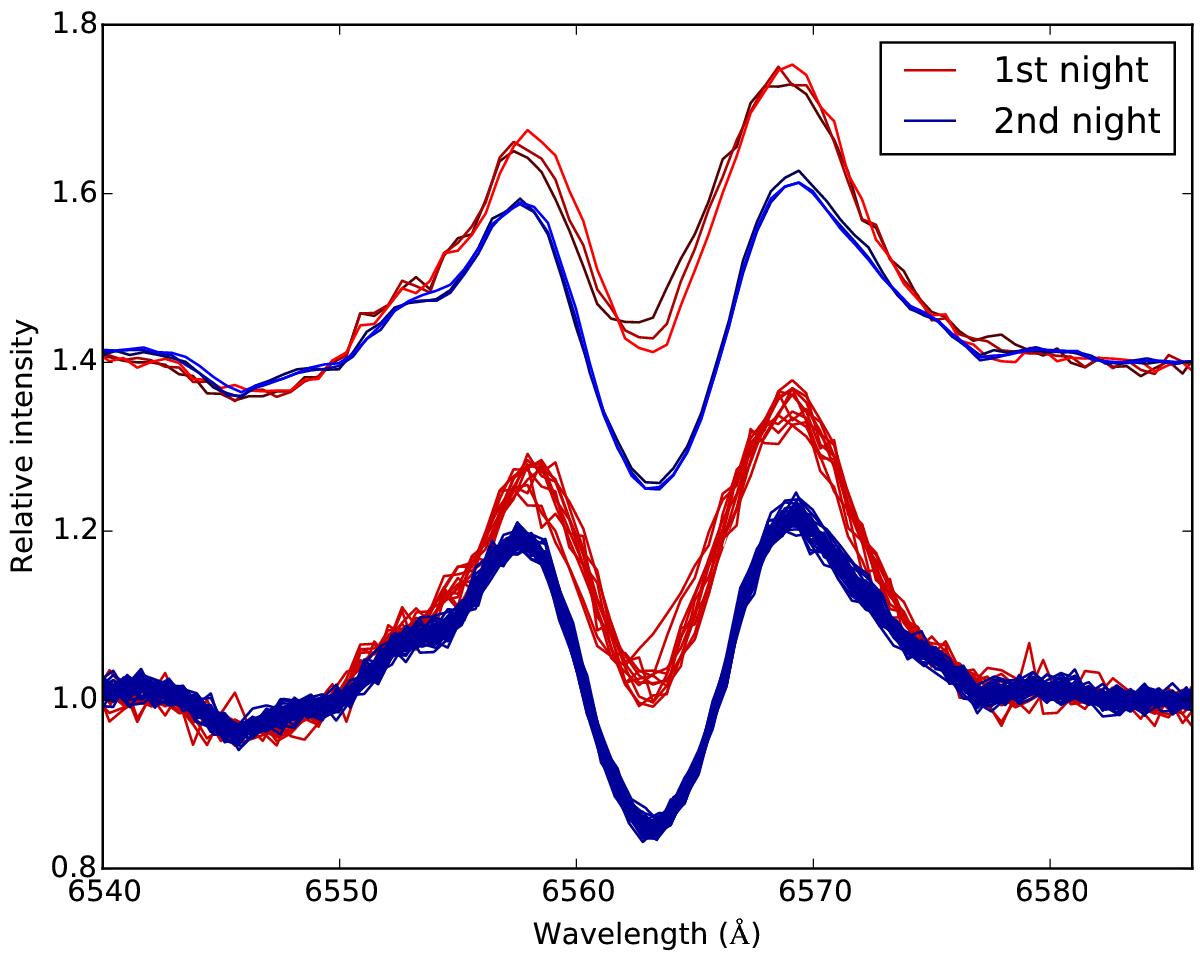
Low-resolution Hα from 1999 February. Red continuous line shows the first, and the blue dashed line shows the second night. The first night covers ~ 3, the second night ~ 2 h. The same spectra, averaged in 30 min windows, are plotted above the original, with colours brightening with time.
Current usage metrics show cumulative count of Article Views (full-text article views including HTML views, PDF and ePub downloads, according to the available data) and Abstracts Views on Vision4Press platform.
Data correspond to usage on the plateform after 2015. The current usage metrics is available 48-96 hours after online publication and is updated daily on week days.
Initial download of the metrics may take a while.