Fig. 14
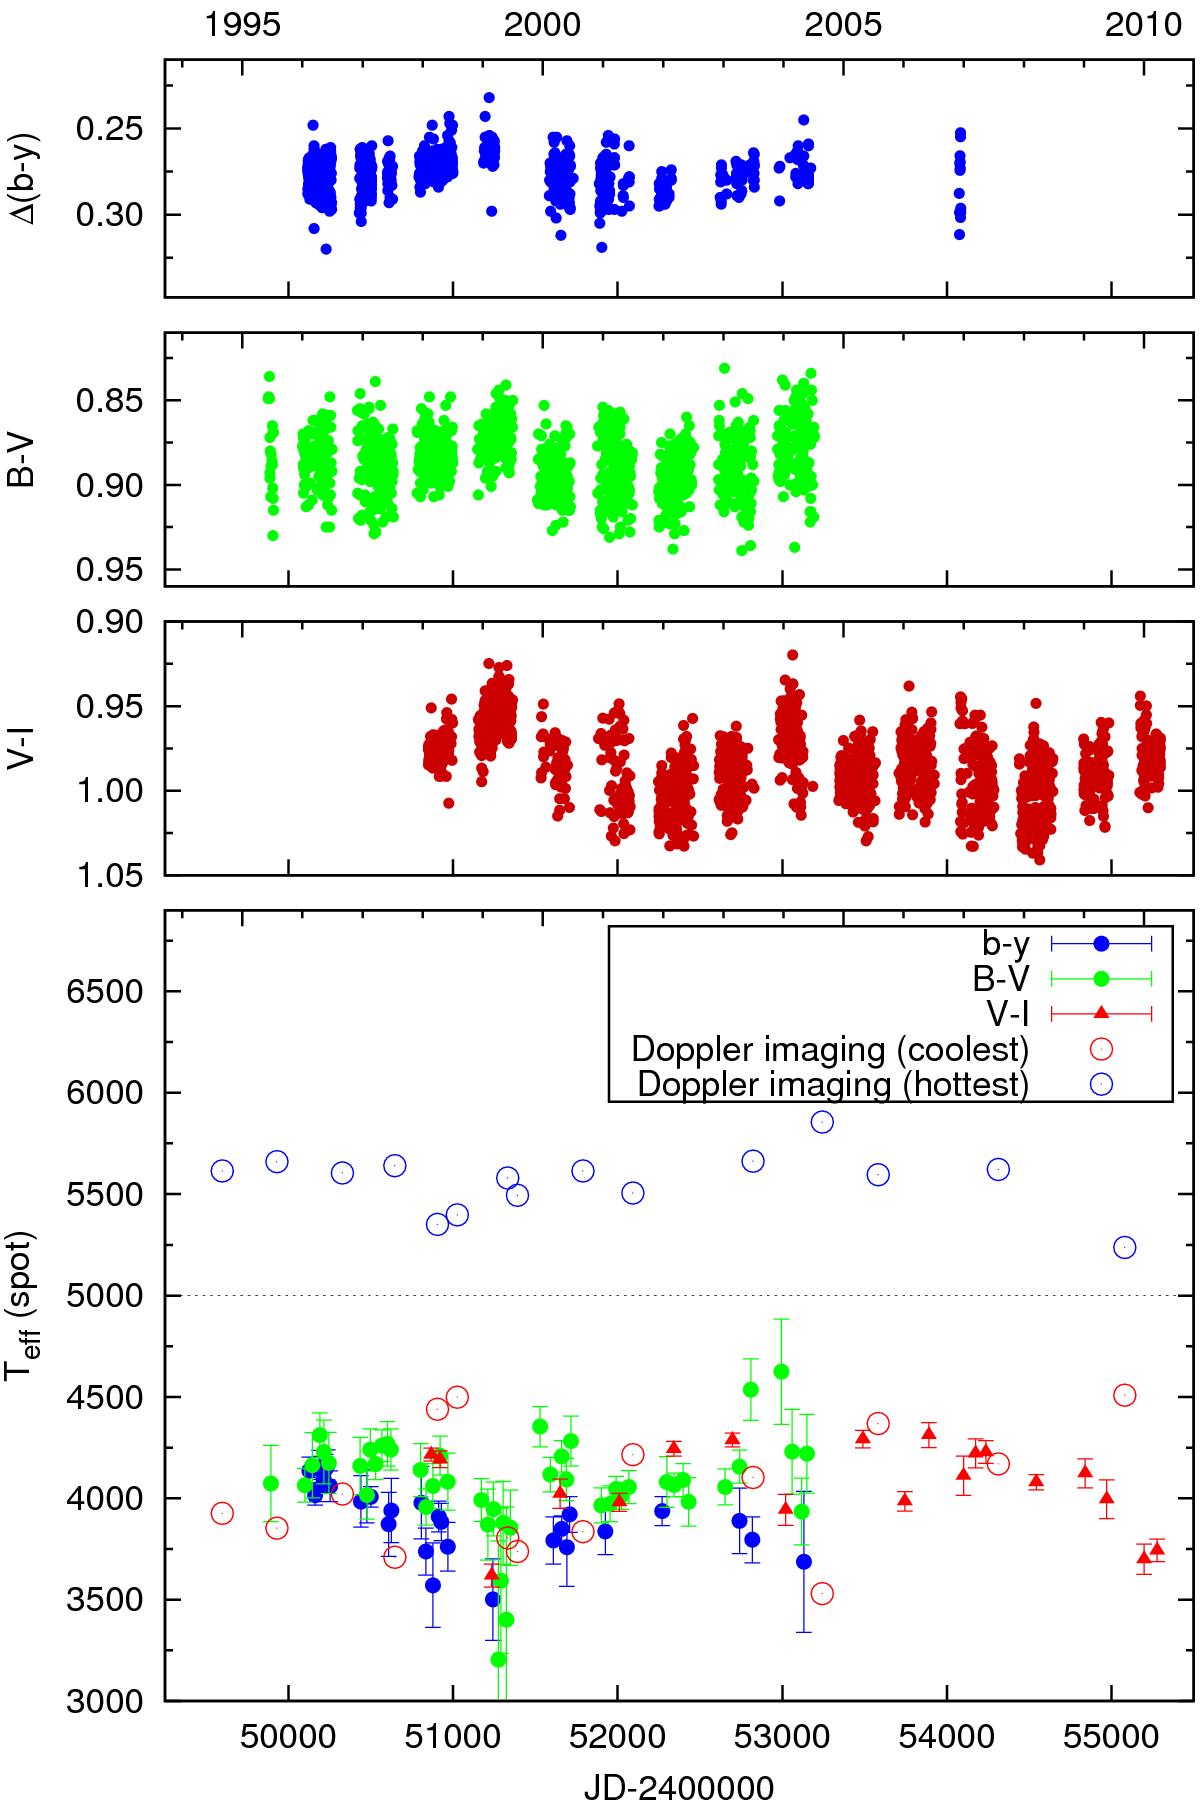
Upper three panels: long-term behaviour of the b − y, B − V, and V − IC colour indices, which reflect the global temperature changes of the star. Bottom panel: starspot temperatures using photometry and Doppler Imaging. The data points for the Doppler-map temperatures are from this paper, Korhonen et al. (1999, 2000, 2007). The horizontal line at 5000 K shows the unspotted temperature.
Current usage metrics show cumulative count of Article Views (full-text article views including HTML views, PDF and ePub downloads, according to the available data) and Abstracts Views on Vision4Press platform.
Data correspond to usage on the plateform after 2015. The current usage metrics is available 48-96 hours after online publication and is updated daily on week days.
Initial download of the metrics may take a while.