Fig. 10
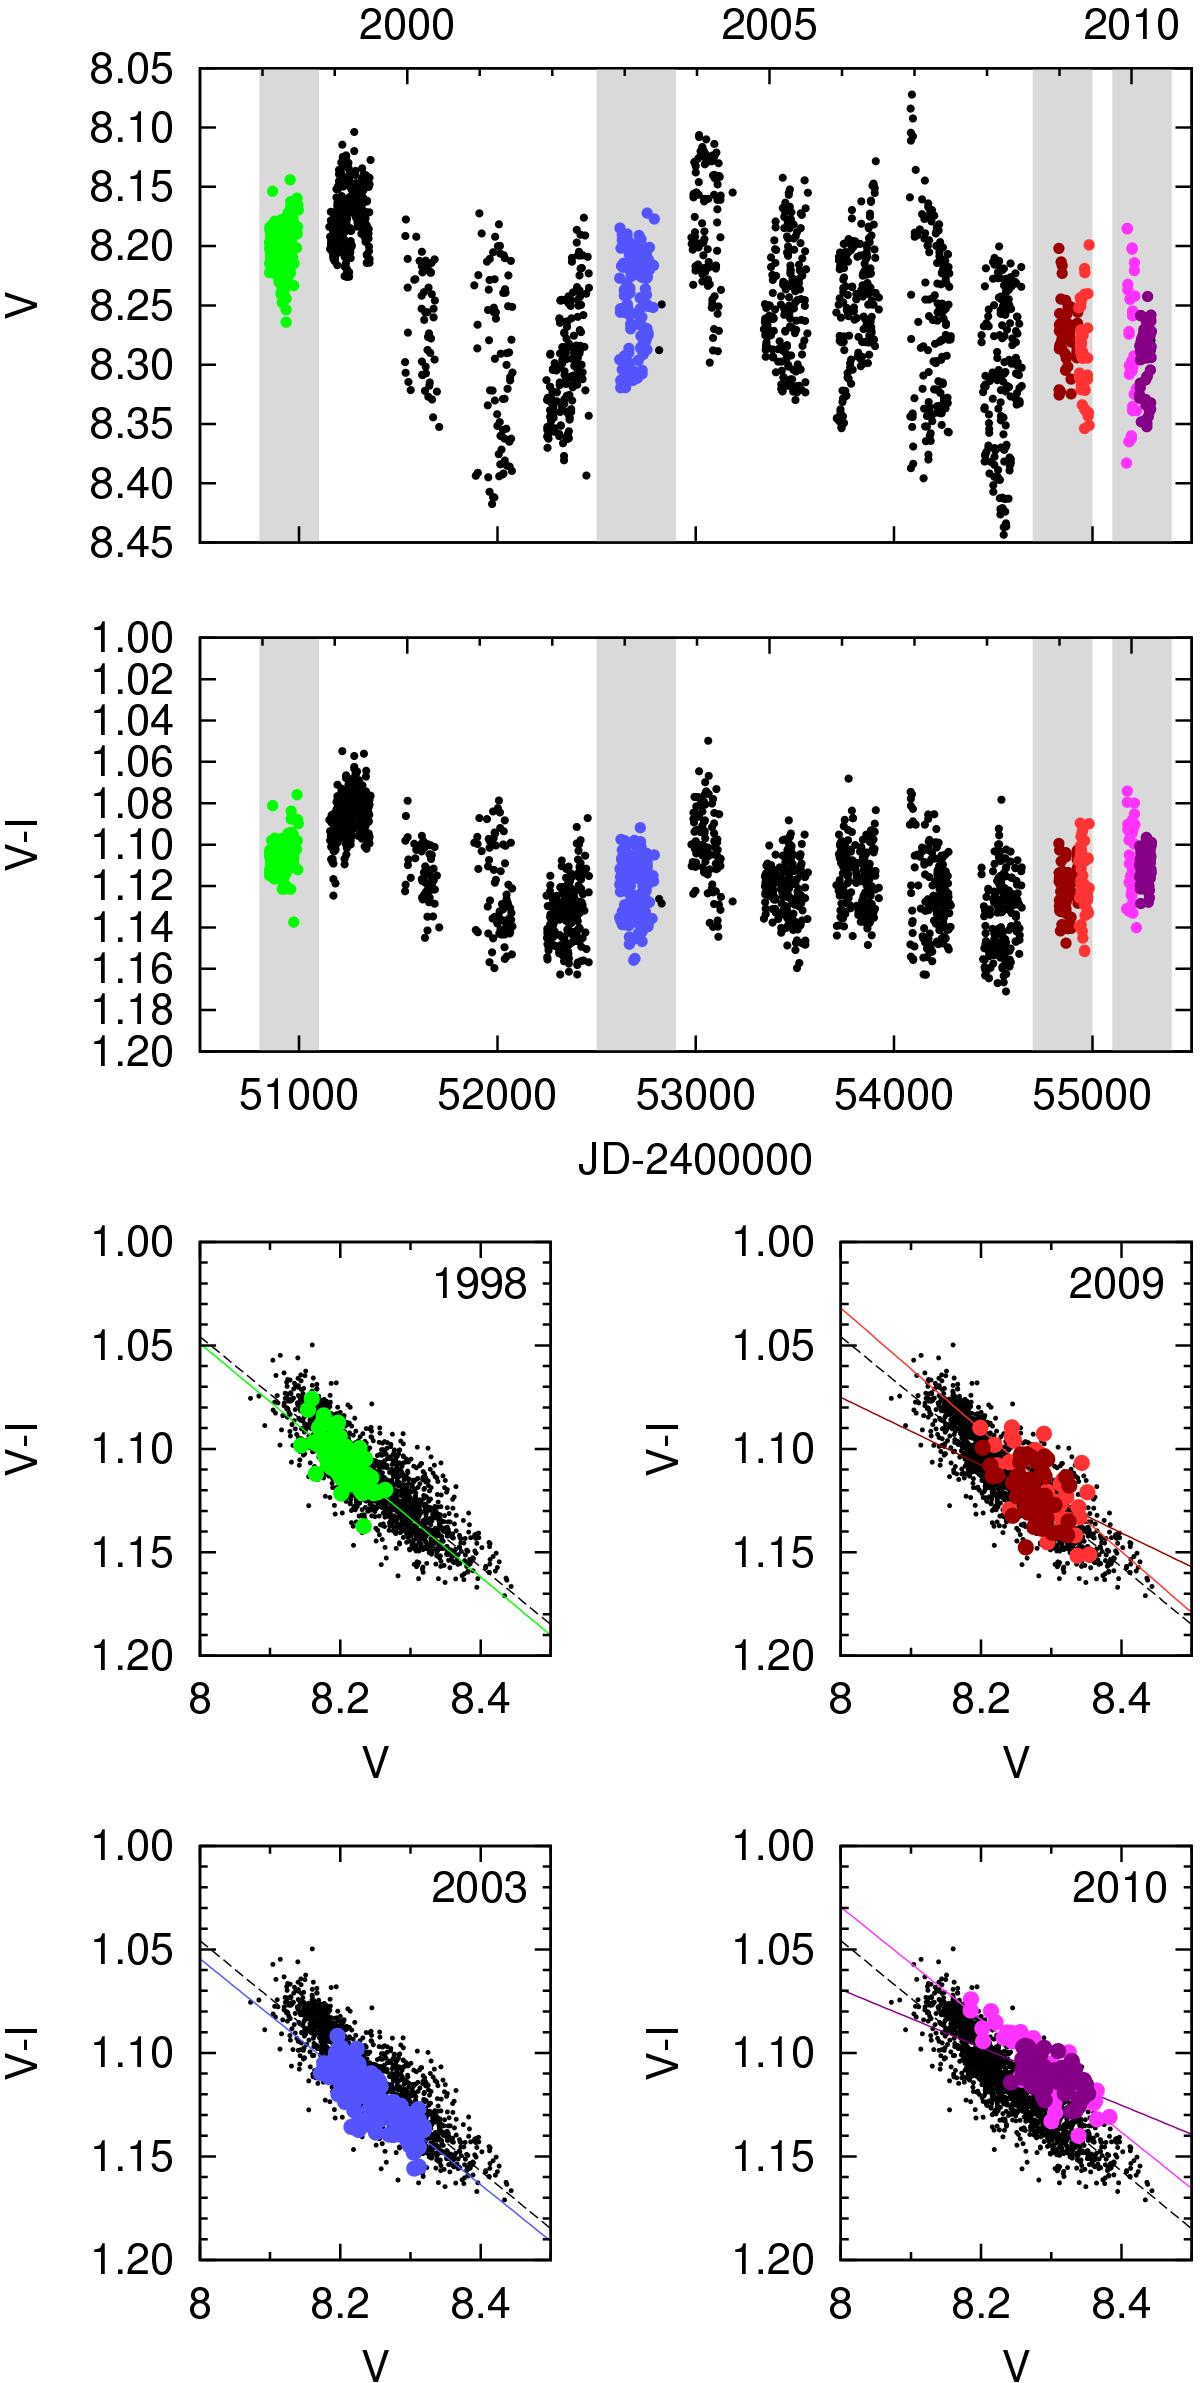
Light curve and magnitude–colour index curves of FK Com using photometric data of Hackman et al. (2013) covering the years 1997−2010. The magnitude–colour index plots show four section of the light curve having lower amplitudes plotted over all data, indicated by small dots. Dashed lines show the best fit to the given sections.
Current usage metrics show cumulative count of Article Views (full-text article views including HTML views, PDF and ePub downloads, according to the available data) and Abstracts Views on Vision4Press platform.
Data correspond to usage on the plateform after 2015. The current usage metrics is available 48-96 hours after online publication and is updated daily on week days.
Initial download of the metrics may take a while.