Fig. 7
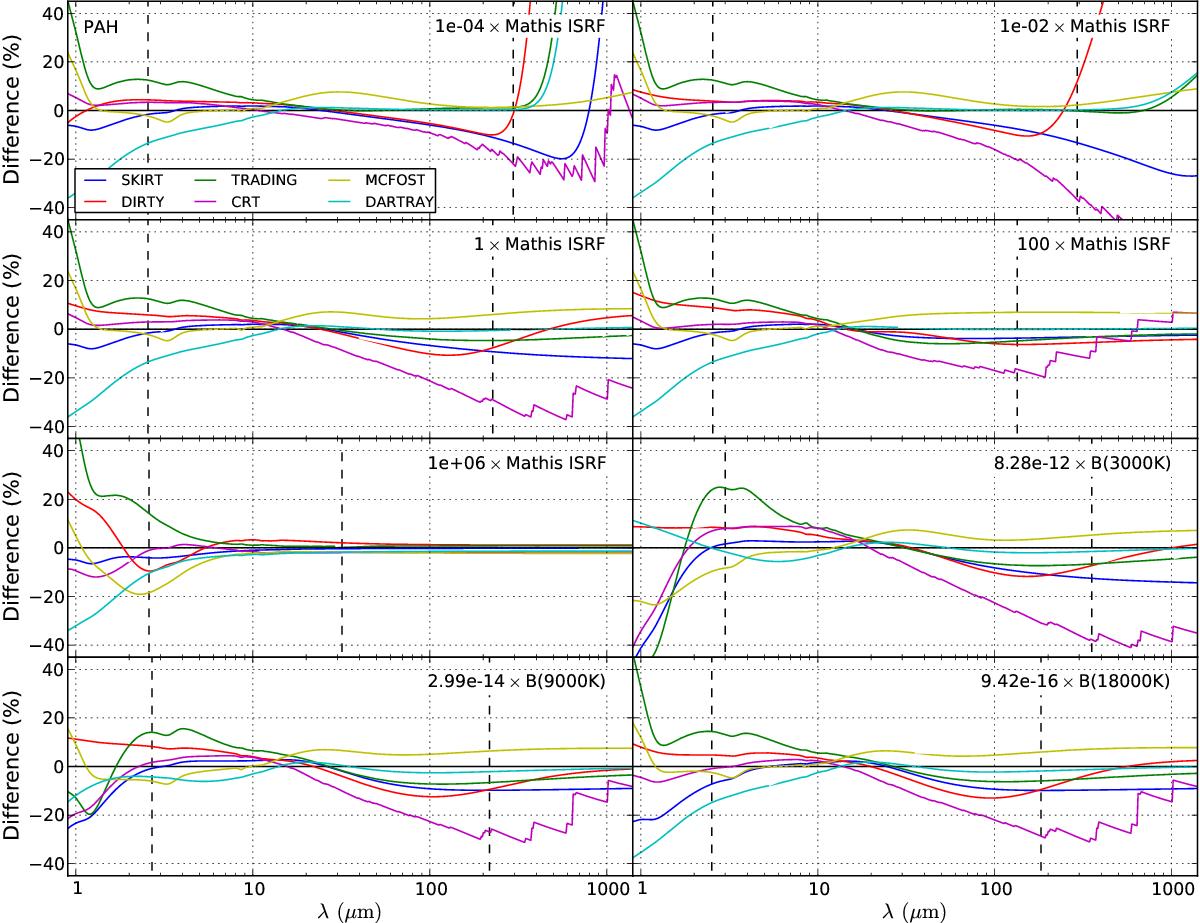
Relative differences between the emissivities of the PAH component calculated by each of the codes participating in this benchmark and the corresponding reference solutions. The panels show the results for a selection of the input fields defined in Sect. 3. In each panel, the reference solution is represented by the zero line. Positive percentages indicate results above the reference solution. The vertical dashed lines indicate where the reference solution becomes three orders of magnitude smaller than its peak value.
Current usage metrics show cumulative count of Article Views (full-text article views including HTML views, PDF and ePub downloads, according to the available data) and Abstracts Views on Vision4Press platform.
Data correspond to usage on the plateform after 2015. The current usage metrics is available 48-96 hours after online publication and is updated daily on week days.
Initial download of the metrics may take a while.