Fig. 3
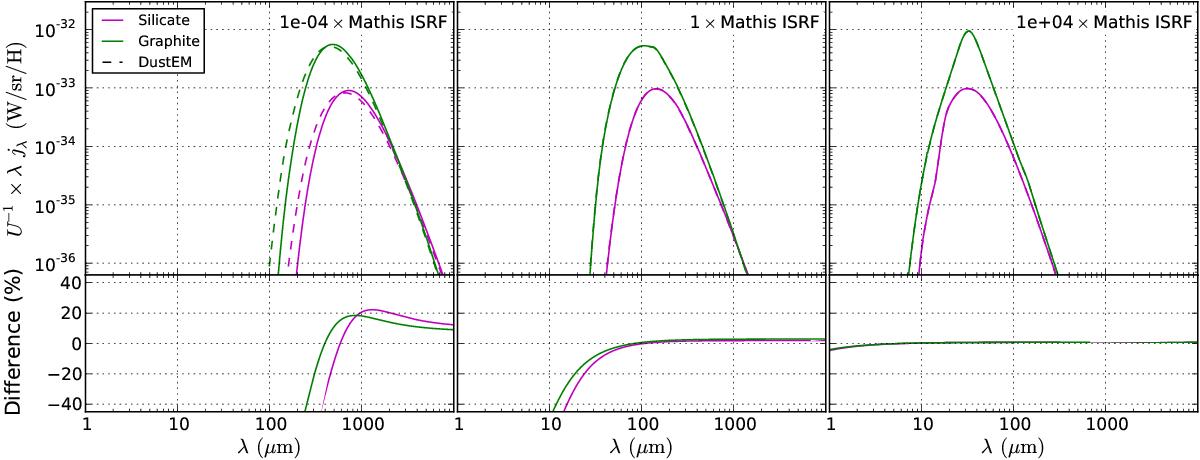
Comparison of the emissivities calculated by DustEM (using 3500 temperature bins and 250 iterations) for single-size, near-LTE grain populations to the corresponding equilibrium emissivities. The panels show the comparison for input fields ranging from extremely weak (left) to strong (right). The emissivity is divided by the input field strength U to allow identical axis ranges for all plots. We used a dust mixture consisting of 0.05 μm silicate (magenta) or graphite (green) grains with a total dust mass per hydrogen atom of 10-30 kg/H for each grain type. The solid curves represent the emissivities calculated by one of our codes (SKIRT) under the assumption of LTE. The dashed curves represent the solutions calculated by DustEM without any LTE assumptions. The lower panels show the deviation of the equilibrium solutions from the corresponding full solutions. In a strong field, where we expect the grains to be in equilibrium, the solutions are indeed virtually identical. In a weaker field, the solutions differ since the grains are no longer completely in equilibrium.
Current usage metrics show cumulative count of Article Views (full-text article views including HTML views, PDF and ePub downloads, according to the available data) and Abstracts Views on Vision4Press platform.
Data correspond to usage on the plateform after 2015. The current usage metrics is available 48-96 hours after online publication and is updated daily on week days.
Initial download of the metrics may take a while.