Fig. 2
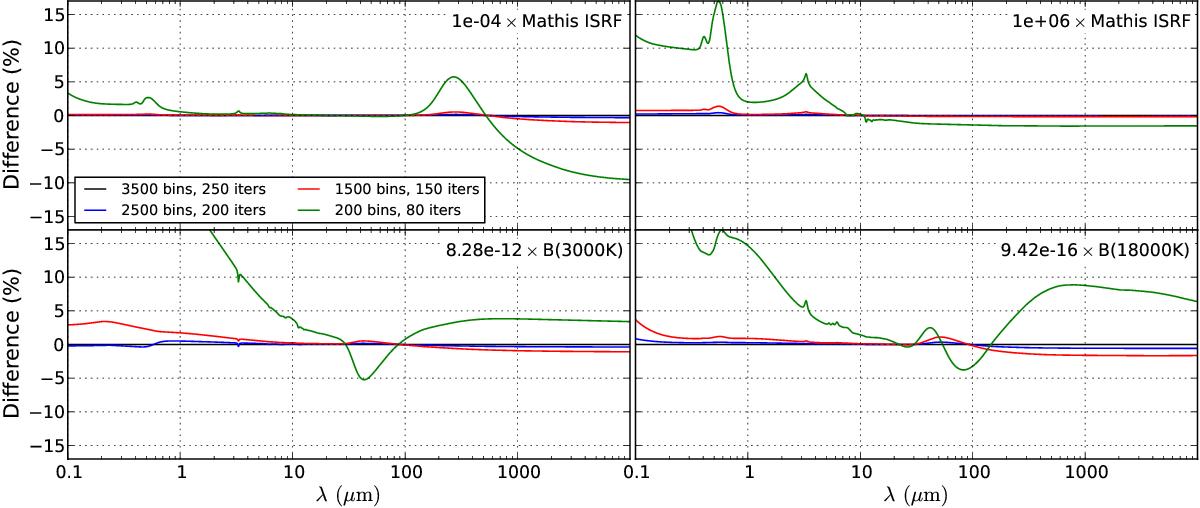
Comparison of DustEM solutions for the most extreme input fields defined in Sect. 3, calculated with a varying number of temperature bins and iterations in the DustEM integral equation solver. The solutions employed as a reference for our benchmark are calculated with 3500 temperature bins and 250 iterations; these solutions are represented in this figure by the zero lines. The solutions calculated with the standard DustEM values of 200 temperature bins and 80 iterations are represented by the green curve. For these extreme fields, the standard solution deviates by up to 20% (and even more for wavelengths shorter than 1 μm). The solutions using 2500 temperature bins and 200 iterations (the blue curve) differ by less than 1% from the reference solution, indicating numerical convergence at these parameter values. The contribution of each grain type separately has a similar convergence behavior (not shown).
Current usage metrics show cumulative count of Article Views (full-text article views including HTML views, PDF and ePub downloads, according to the available data) and Abstracts Views on Vision4Press platform.
Data correspond to usage on the plateform after 2015. The current usage metrics is available 48-96 hours after online publication and is updated daily on week days.
Initial download of the metrics may take a while.