Fig. 1
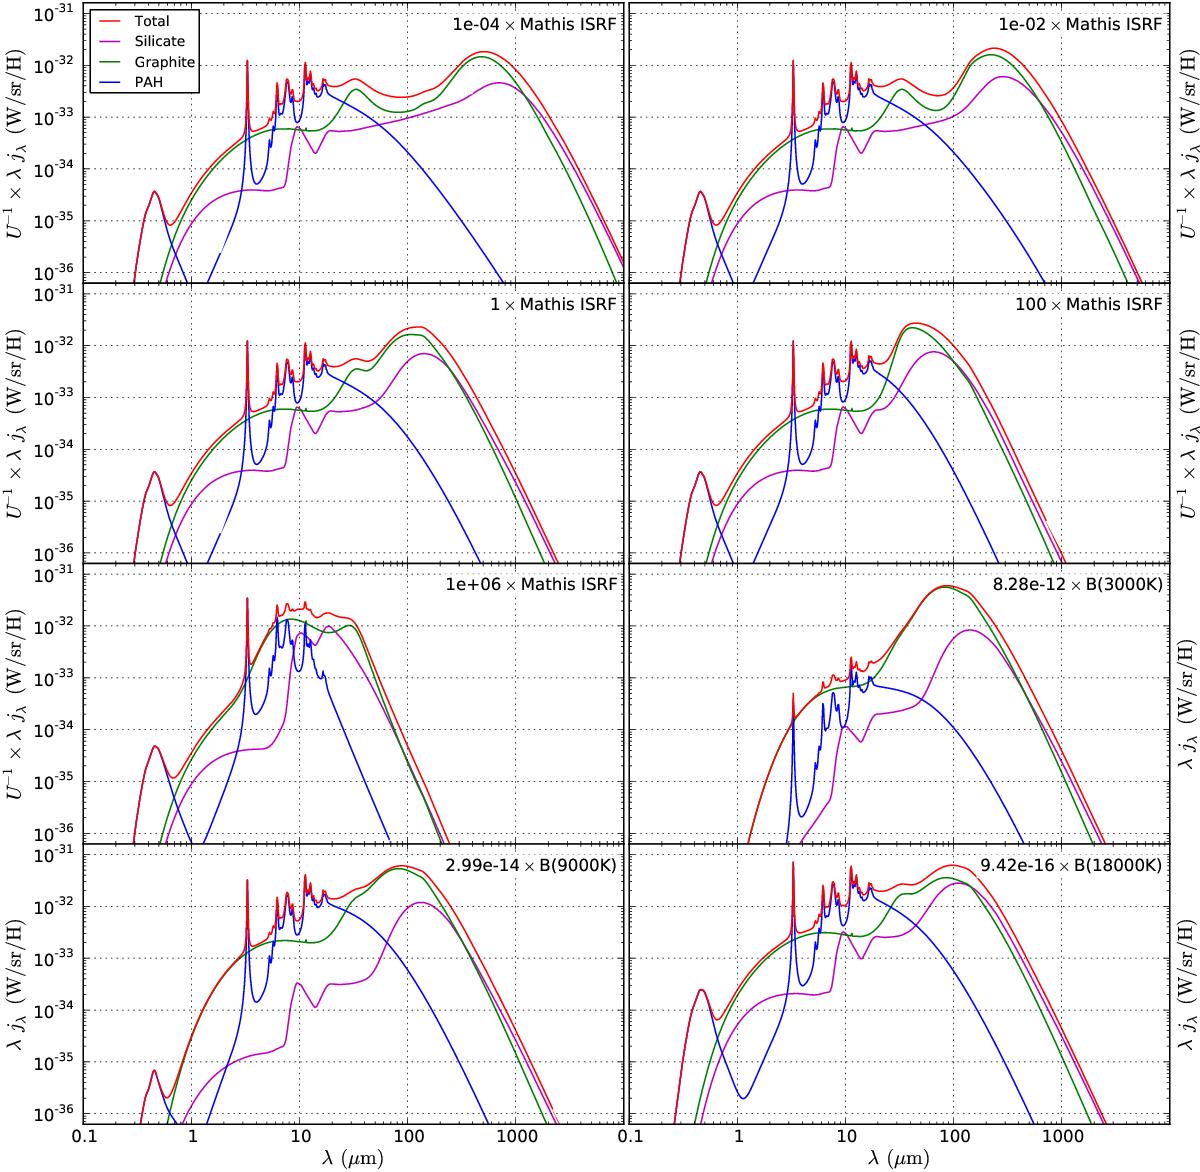
Reference solutions generated with the public version of DustEM (see Sect. 5.1) using 3500 temperature bins and 250 iterations in the integral equation solver. The panels show the calculated dust emissivity for a selection of the input fields defined in Sect. 3. In each panel, the red curve represents the total emissivity and the other curves represent the portion of the emissivity for each grain type, silicate (magenta), graphite (green), and PAHs (blue). For the scaled Mathis input fields, the emissivity is divided by the input field strength U to allow identical axis ranges for all plots.
Current usage metrics show cumulative count of Article Views (full-text article views including HTML views, PDF and ePub downloads, according to the available data) and Abstracts Views on Vision4Press platform.
Data correspond to usage on the plateform after 2015. The current usage metrics is available 48-96 hours after online publication and is updated daily on week days.
Initial download of the metrics may take a while.