Fig. 4
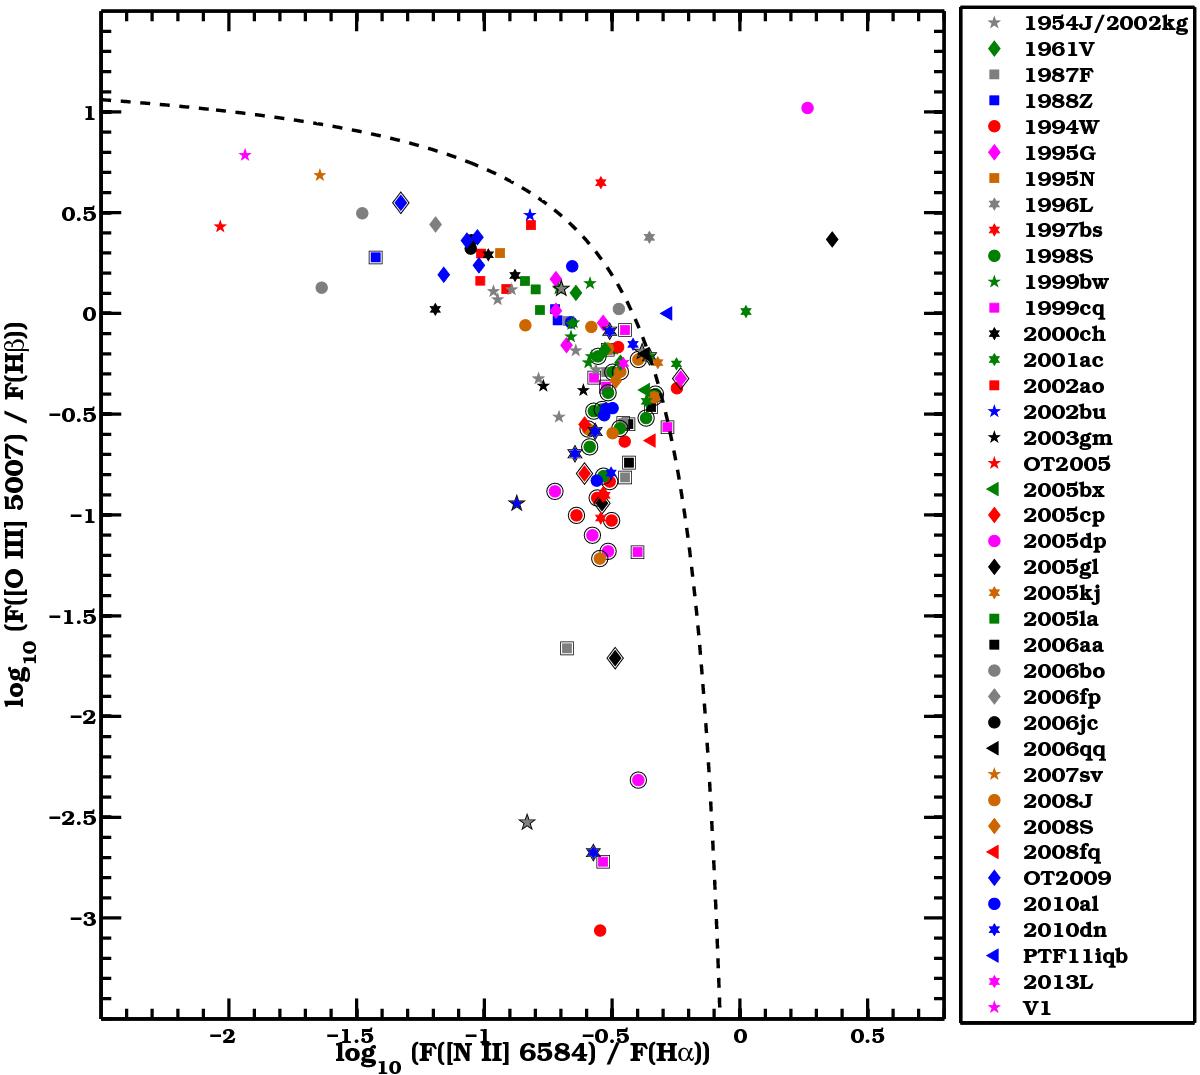
BPT diagram for each H ii region that we spectroscopically observed. Above the dashed line (Kauffmann et al. 2003, see Sect. 4) the line fluxes are AGN contaminated and we rejected those spectra from our metallicity study. Most of the spectra fall in the star-forming part of the BPT diagram, below the dashed line. The symbols marked with black edges indicate that the ratio between [O iiiλ5007] and Hβ is an upper limit. All the line ratios are reported in Table 3.
Current usage metrics show cumulative count of Article Views (full-text article views including HTML views, PDF and ePub downloads, according to the available data) and Abstracts Views on Vision4Press platform.
Data correspond to usage on the plateform after 2015. The current usage metrics is available 48-96 hours after online publication and is updated daily on week days.
Initial download of the metrics may take a while.