Fig. 16
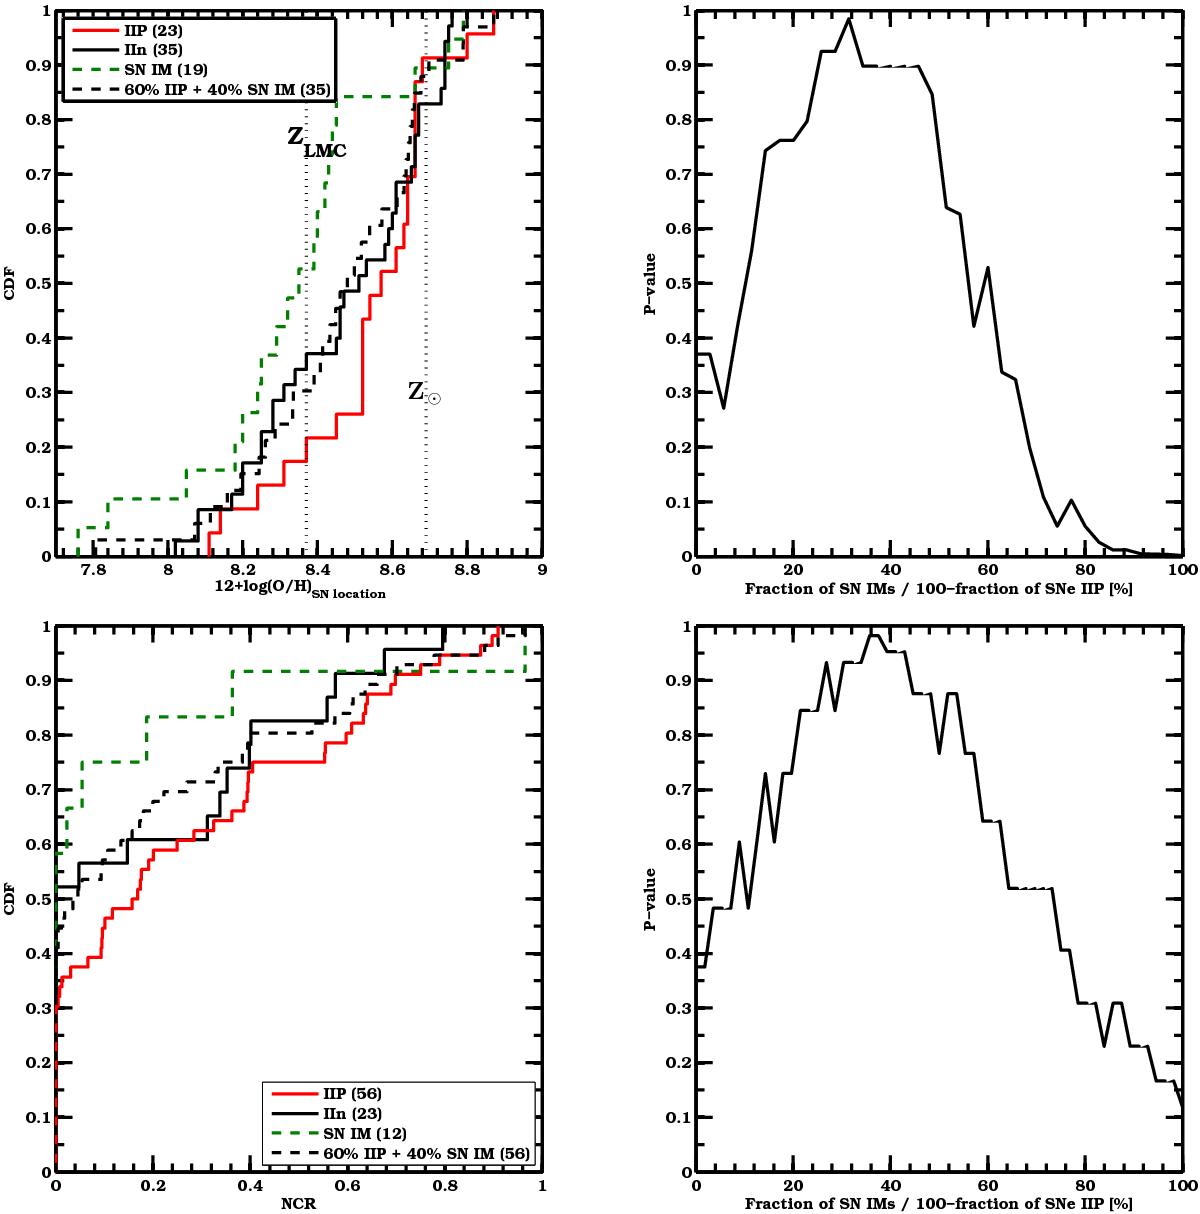
Top left panel: metallicity CDFs of SNe IIn, SN IMs, SNe IIP, and of a simulated SN progenitor population constructed of SN IM/LBVs and SN IIP/RSGs, which fit the observed SN IIn metallicity CDF. Top right panel: p-value of the K-S test between the metallicity distributions of SNe IIn and the simulated progenitor population as a function of the fraction of LBVs in the simulated progenitor population. Bottom left panel: NCR CDFs of SNe IIn, SN IMs, SNe IIP, and of a simulated SN progenitor population made of SN IM/LBVs and SN IIP/RSGs, which fit the observed SN IIn NCR CDF. Data from H14 and Anderson et al. (2012). Bottom right panel: p-value of the K-S test between the NCR distributions of SNe IIn and the simulated progenitor population as a function of the fraction of SN IM/LBVs in the simulated progenitor population.
Current usage metrics show cumulative count of Article Views (full-text article views including HTML views, PDF and ePub downloads, according to the available data) and Abstracts Views on Vision4Press platform.
Data correspond to usage on the plateform after 2015. The current usage metrics is available 48-96 hours after online publication and is updated daily on week days.
Initial download of the metrics may take a while.