Fig. 3
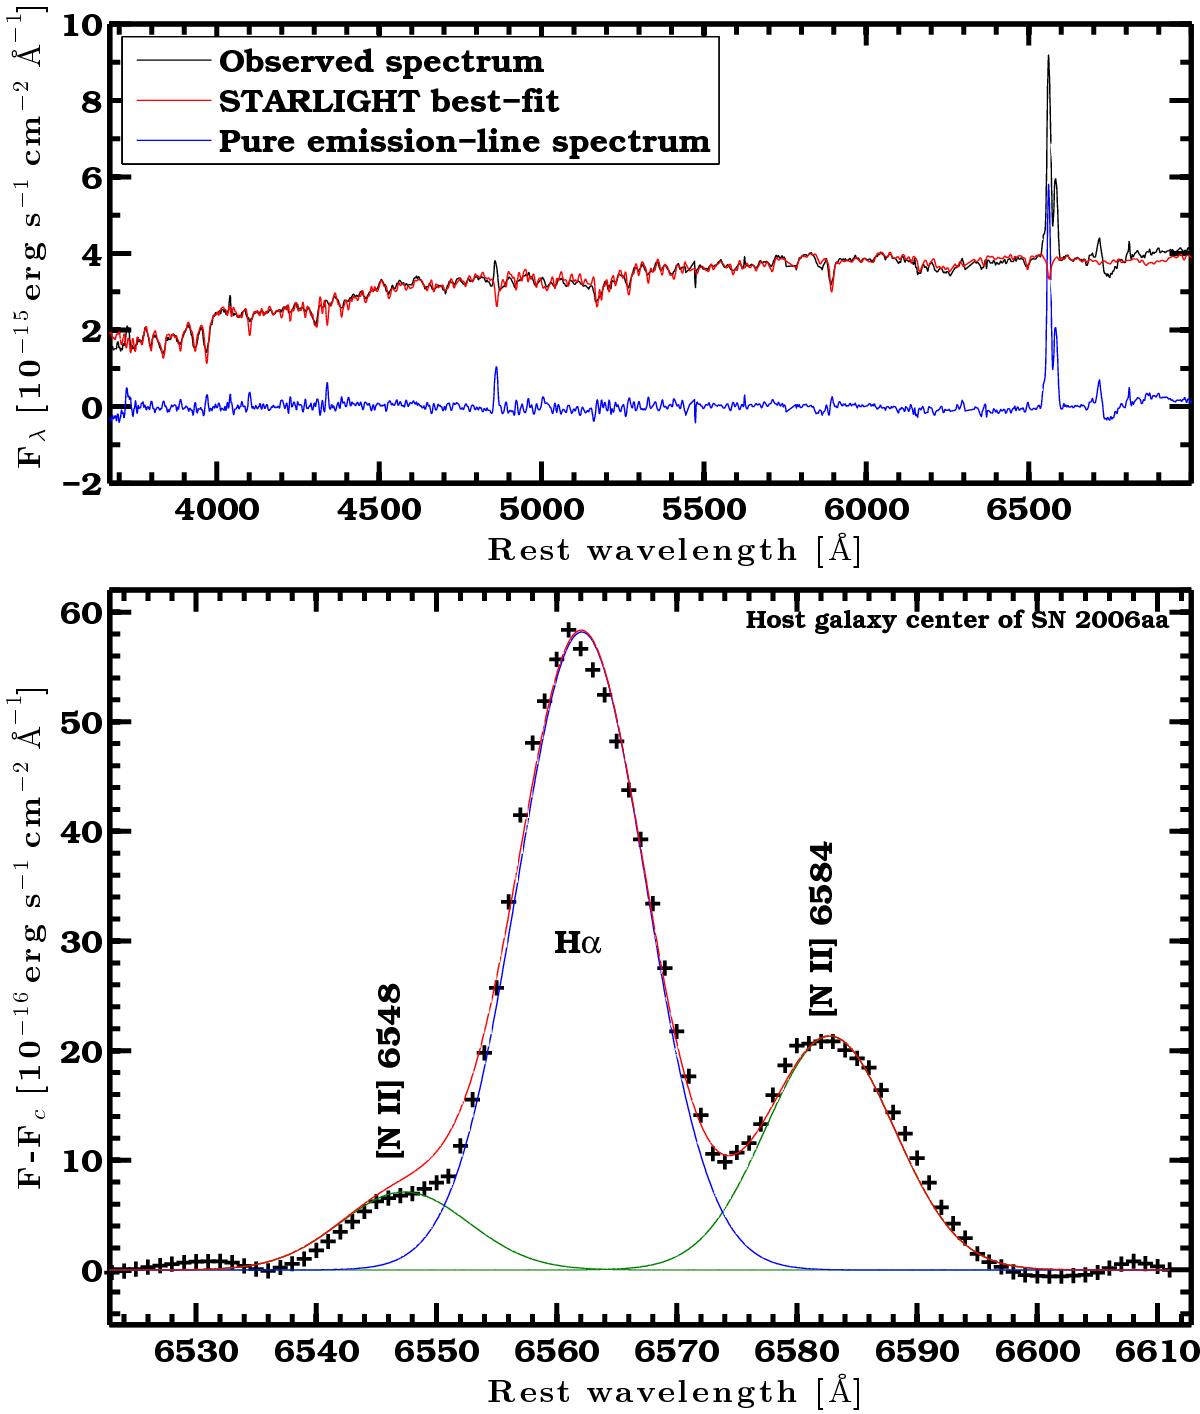
Top panel: STARLIGHT stellar-population spectrum best fit to the continuum of the spectrum obtained at the center of the host galaxy of SN 2006aa. The difference between the observed spectrum and the best fit gives the pure emission-line spectrum. Bottom panel: the triple-Gaussian fit on the continuum-subtracted Hα and [N ii] lines of the bright H ii region at the center of the host galaxy of SN 2006aa. The observed fluxes are represented with black crosses, the best fit in red, the Hα component in blue, and the [N ii] components in green.
Current usage metrics show cumulative count of Article Views (full-text article views including HTML views, PDF and ePub downloads, according to the available data) and Abstracts Views on Vision4Press platform.
Data correspond to usage on the plateform after 2015. The current usage metrics is available 48-96 hours after online publication and is updated daily on week days.
Initial download of the metrics may take a while.