Fig. 14
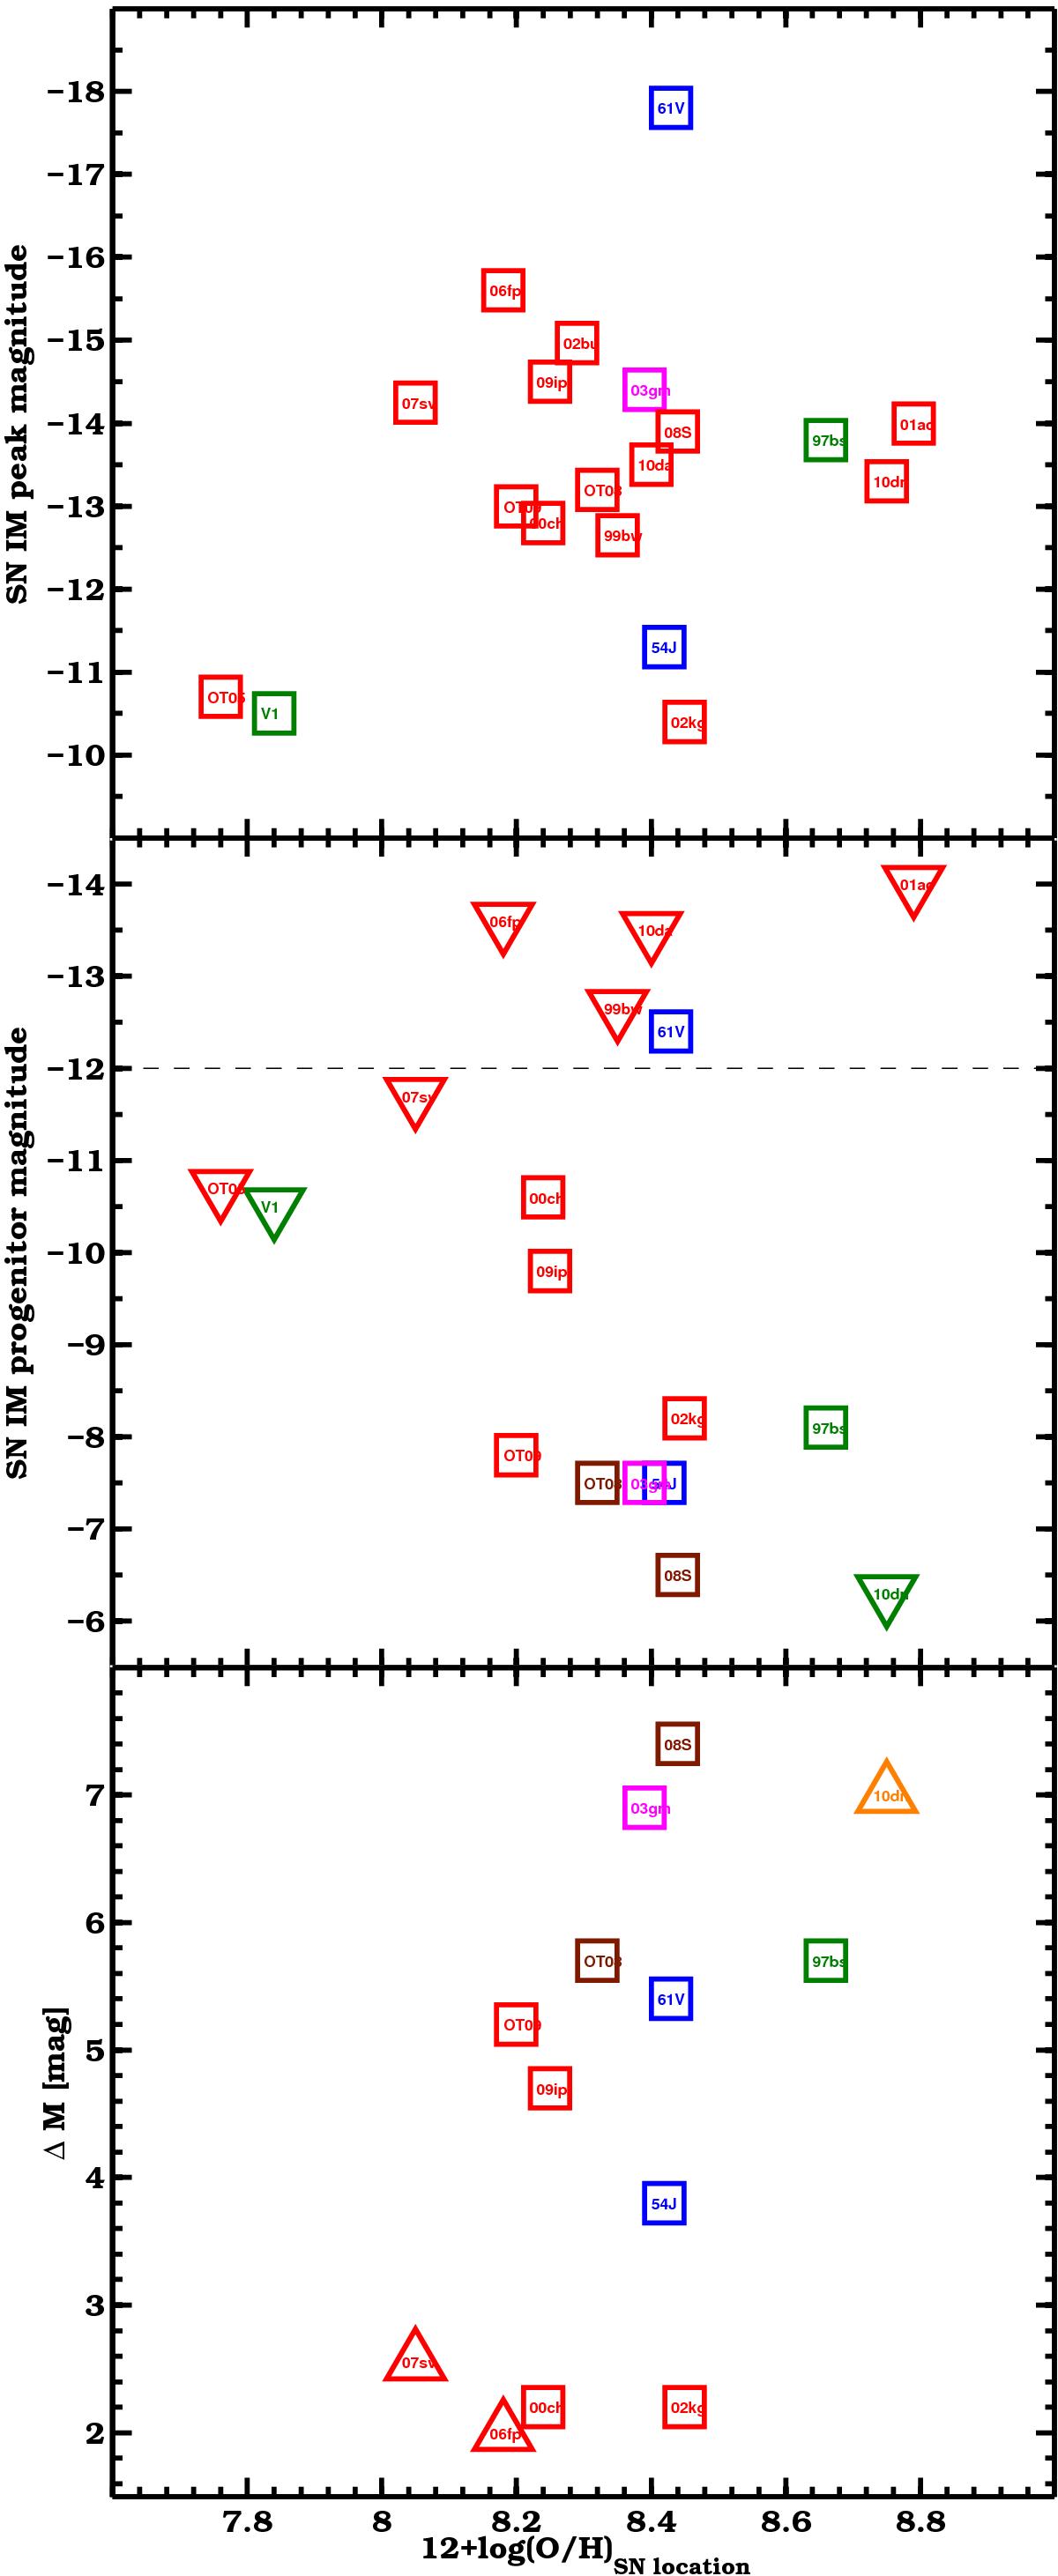
Top panel: SN IM peak absolute magnitudes (from Smith et al. 2011a) versus local metallicity. Central panel: absolute magnitude of SN IM progenitors (from Smith et al. 2011a) versus local metallicities. Triangles are lower limits. With the exception of SN 1961V and of those events where we have limits poorer than −12 mag, at lower metallicity the luminosity seems to be higher. Bottom panel: difference between each peak outburst and the corresponding progenitor magnitude versus metallicity is shown. Triangles are lower limits. The data suggest larger ΔM at larger metallicity. Red corresponds to R/unf. bands, blue to B band, green to V band, magenta to I band, brown to NIR, orange to R/V.
Current usage metrics show cumulative count of Article Views (full-text article views including HTML views, PDF and ePub downloads, according to the available data) and Abstracts Views on Vision4Press platform.
Data correspond to usage on the plateform after 2015. The current usage metrics is available 48-96 hours after online publication and is updated daily on week days.
Initial download of the metrics may take a while.