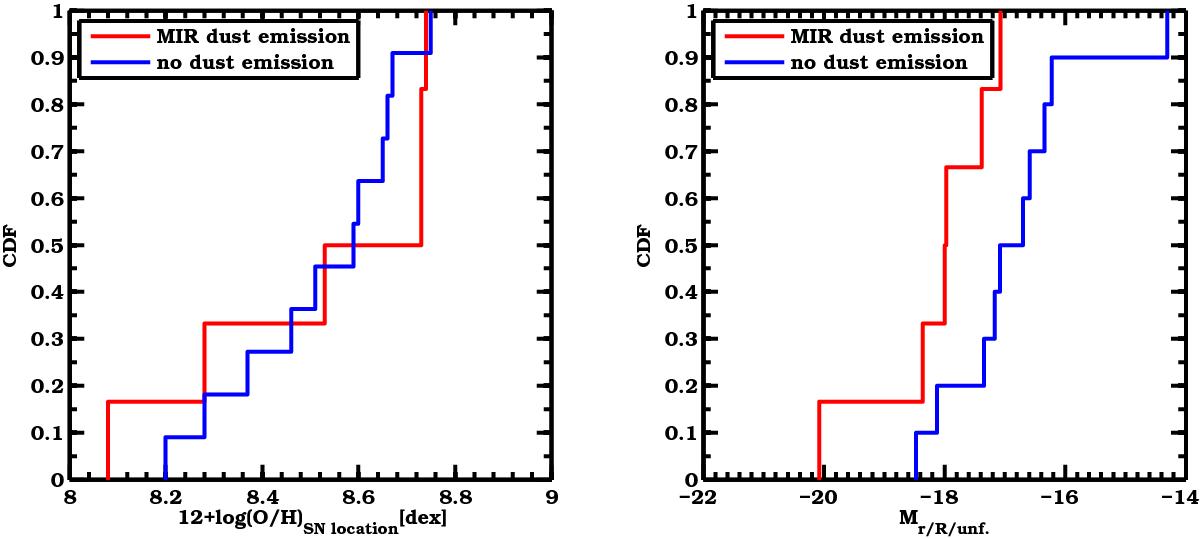
Fig. 13

Left-hand panel: metallicity CDFs for CSI SNe showing and not showing MIR dust emission at late epochs (Fox et al. 2011). These CDFs do not show any statistically significant difference. Right-hand panel: CDFs of the peak absolute r/R/unf. band magnitudes for the same CSI SNe showing and not showing MIR dust emission at late epochs. These CDFs show that SNe with MIR dust emission tend to be brighter at peak.
Current usage metrics show cumulative count of Article Views (full-text article views including HTML views, PDF and ePub downloads, according to the available data) and Abstracts Views on Vision4Press platform.
Data correspond to usage on the plateform after 2015. The current usage metrics is available 48-96 hours after online publication and is updated daily on week days.
Initial download of the metrics may take a while.


