Fig. 12
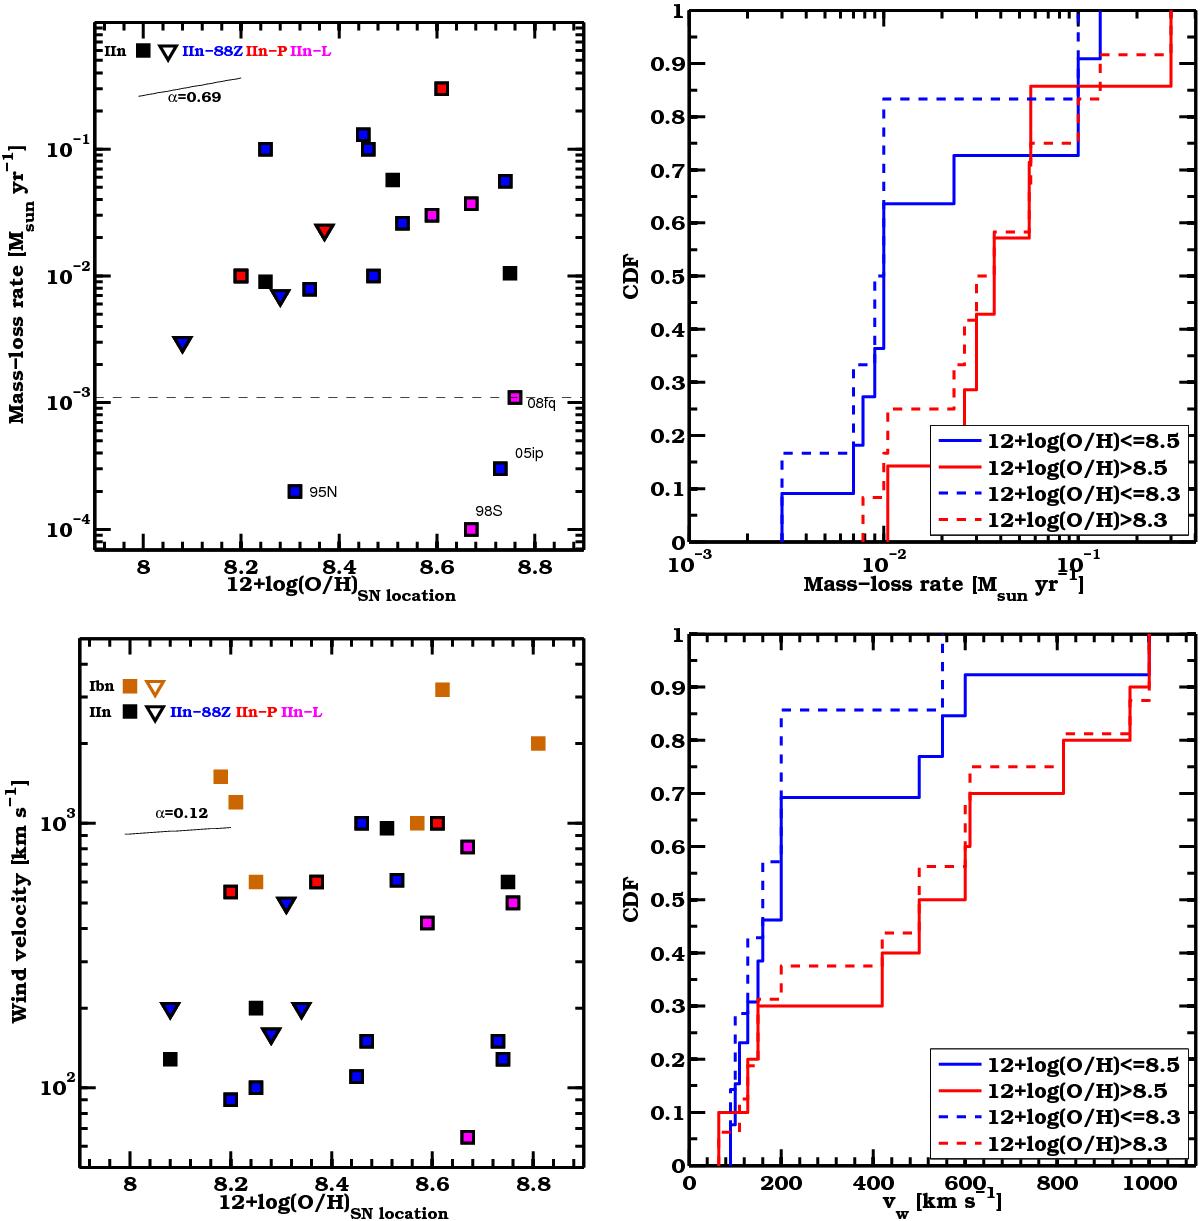
Top left panel: mass-loss rates of SNe IIn versus local metallicity measurements. Triangles are upper limits. Above 10-3M⊙ yr-1, the mass-loss rates appear to be higher at higher metallicity. The power-law (PL) dependence on metallicity (α = 0.69 e.g., Vink 2011) of the line-driven mass-loss rates is shown with a black segment and is consistent with the data. SNe IIn-L (98S-like) typically show lower mass-loss rates than long-lasting SN IIn (88Z-like). Top right panel: mass-loss rate CDFs for metal-poor and metal-rich SNe IIn, shown to better highlight that at higher metallicities the mass-loss rates tend to be higher. Two different metallicity cuts are shown, at log(O/H) + 12 = 8.3 and 8.5. Bottom left panel: wind velocities of SNe IIn and SNe Ibn versus local metallicities. Triangles are upper limits. The PL dependence on metallicity (α= 0.12 (e.g., Kudritzki 2002) of the line-driven wind velocities rates is shown with a black segment, and is consistent with the data. SNe IIn-L (98S-like) typically show higher wind velocities than long-lasting SN IIn (88Z-like). Bottom right panel: wind-velocity CDFs, for metal-poor and metal-rich SNe IIn, shown to better highlight that at higher metallicities the wind velocities tend to be slightly higher. Two different metallicity cuts are shown, at log(O/H) + 12 = 8.3 and 8.5.
Current usage metrics show cumulative count of Article Views (full-text article views including HTML views, PDF and ePub downloads, according to the available data) and Abstracts Views on Vision4Press platform.
Data correspond to usage on the plateform after 2015. The current usage metrics is available 48-96 hours after online publication and is updated daily on week days.
Initial download of the metrics may take a while.