Fig. 6
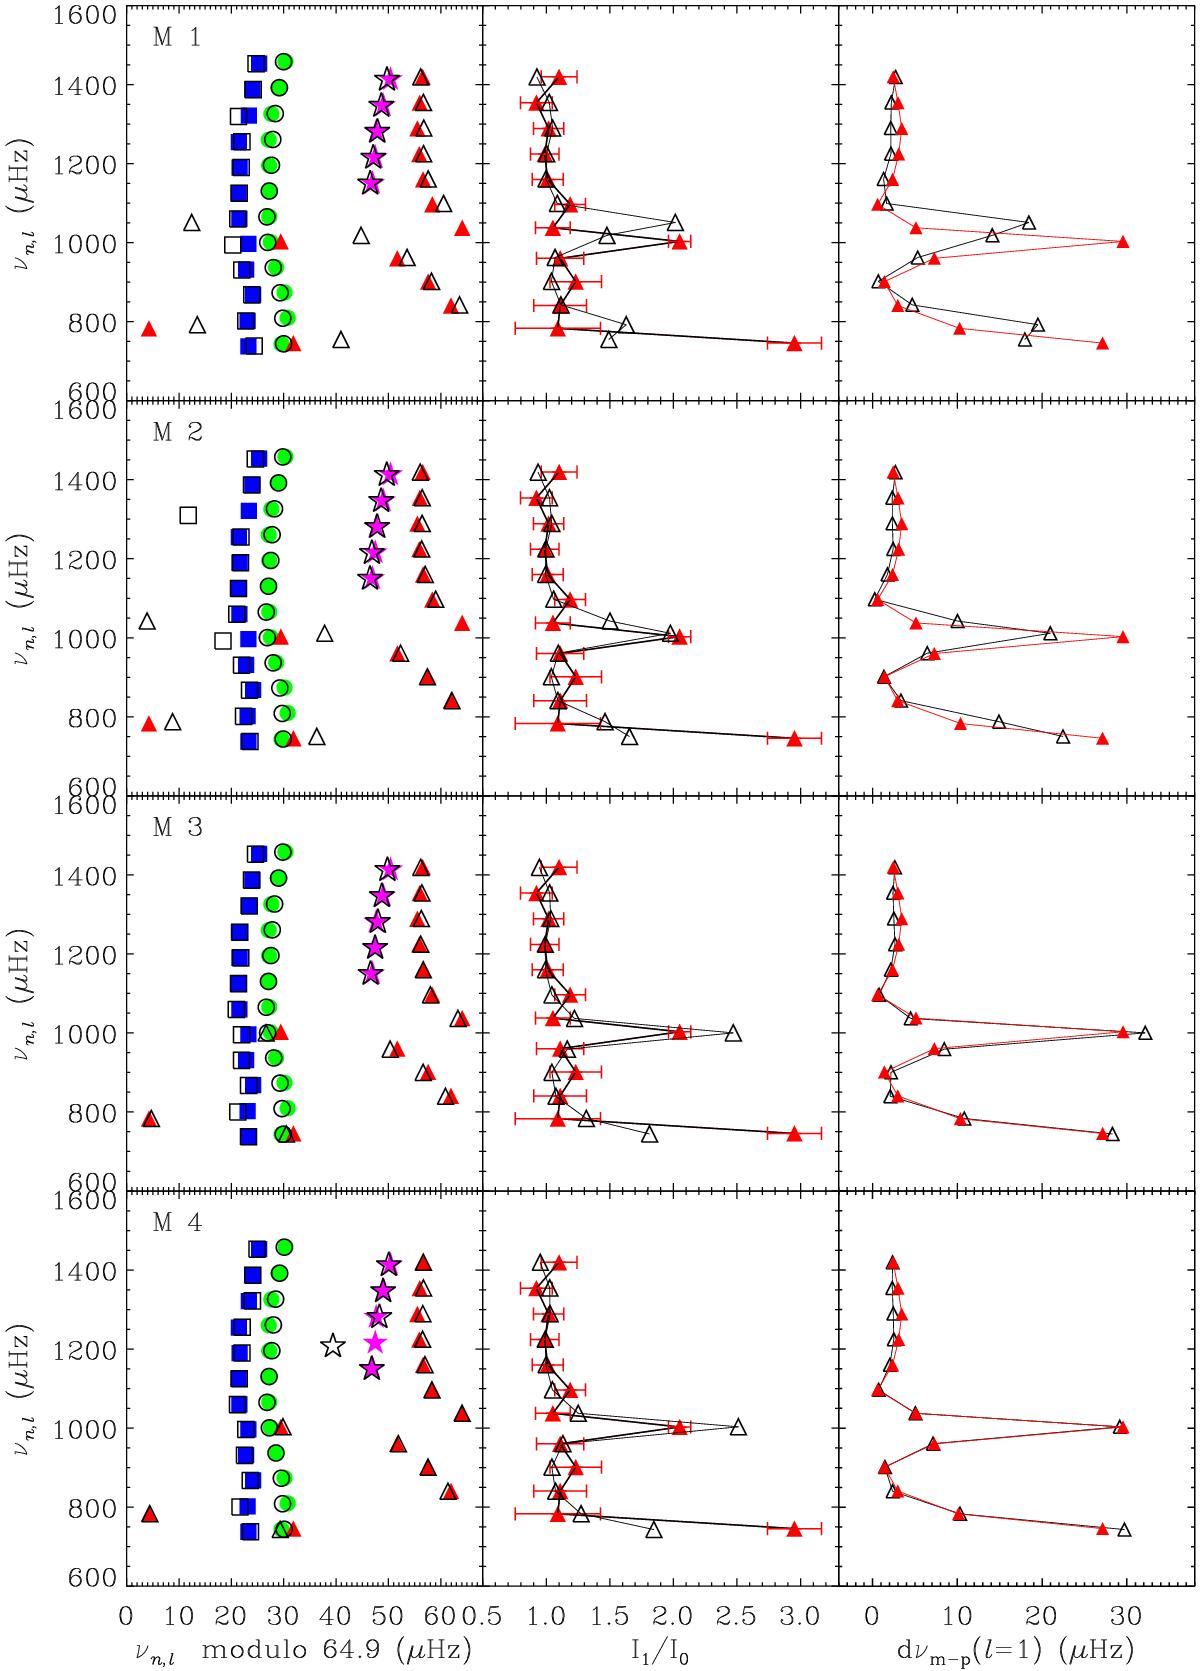
Comparison of echelle diagram, inertia ratios, and dνm−p from observations and models without diffusion for KIC 6442183. The color-filled symbols denote the observed frequencies, and the empty symbols are the corrected theoretical frequencies. The squares denote the l = 2 modes, while the circles show the l = 0, the triangle the l = 1, and the five-pointed star the l = 3 modes. We did not plot the frequency error bars since these are smaller than the symbol signs.
Current usage metrics show cumulative count of Article Views (full-text article views including HTML views, PDF and ePub downloads, according to the available data) and Abstracts Views on Vision4Press platform.
Data correspond to usage on the plateform after 2015. The current usage metrics is available 48-96 hours after online publication and is updated daily on week days.
Initial download of the metrics may take a while.