Free Access
Fig. 5
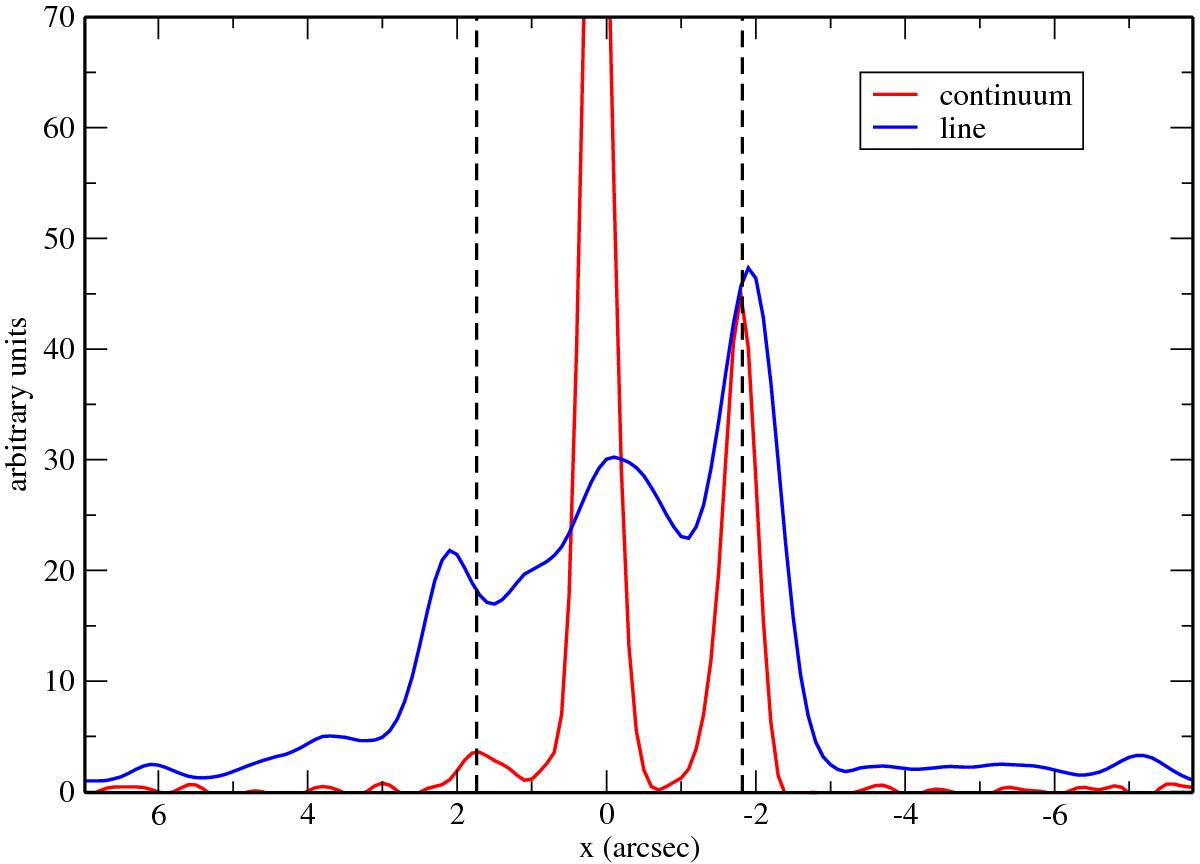
Brightness distribution, in arbitrary units, along the direction of the radio jet of the synchrotron continuum emission (red line) and of the CO(2−1) emission (blue line). The dashed vertical lines indicate the peaks of the continuum hot spots, showing that the bright CO slightly extends beyond the hot spots.
Current usage metrics show cumulative count of Article Views (full-text article views including HTML views, PDF and ePub downloads, according to the available data) and Abstracts Views on Vision4Press platform.
Data correspond to usage on the plateform after 2015. The current usage metrics is available 48-96 hours after online publication and is updated daily on week days.
Initial download of the metrics may take a while.