Fig. 3
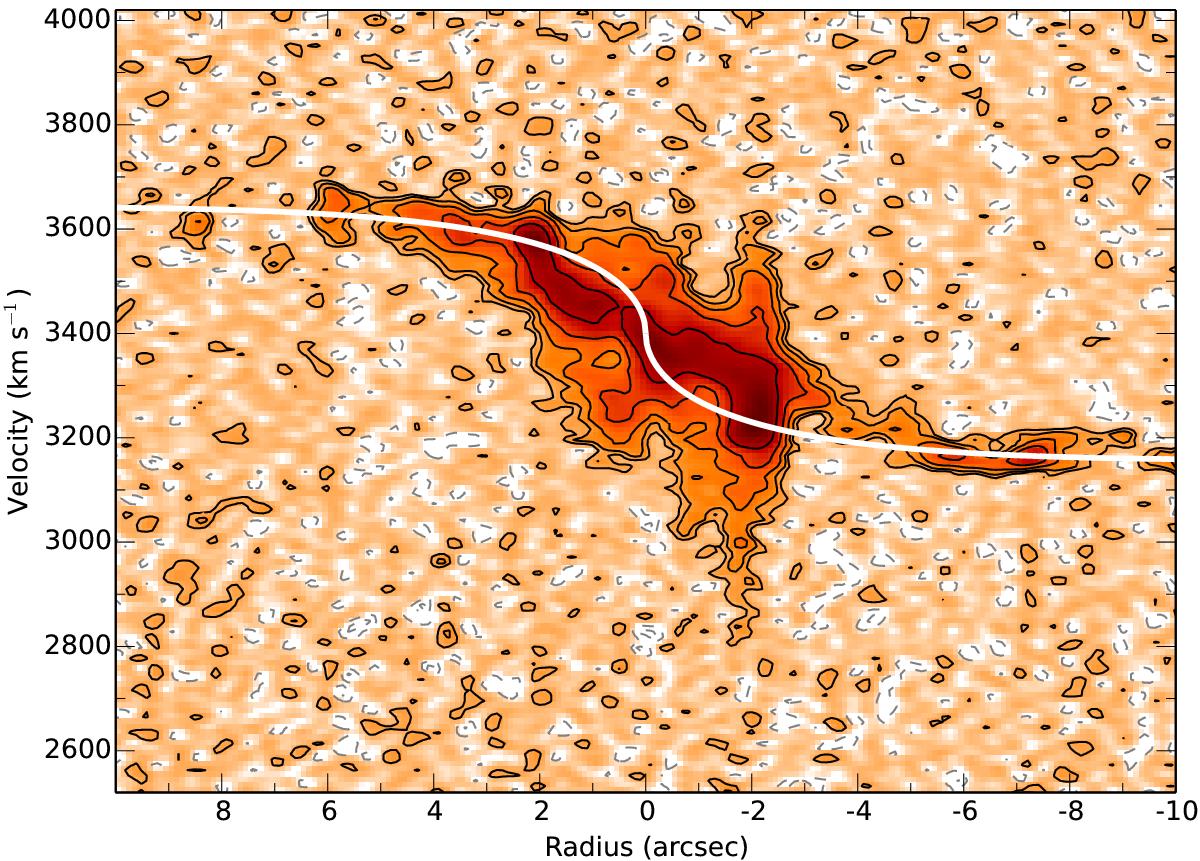
Integrated position-velocity map taken along the major axis of IC 5063 in which the data were integrated over a length of 2 arcsec in the direction perpendicular to the major axis. The white line gives the rotation curve we derived from the photometry of Kulkarni et al. (1998), and indicates the expected kinematics of gas following regular rotation. Contour levels are –3, –1.5, 1.5, 3, 6, 12, and 24 σ. Positive radii are east of the centre.
Current usage metrics show cumulative count of Article Views (full-text article views including HTML views, PDF and ePub downloads, according to the available data) and Abstracts Views on Vision4Press platform.
Data correspond to usage on the plateform after 2015. The current usage metrics is available 48-96 hours after online publication and is updated daily on week days.
Initial download of the metrics may take a while.