Fig. 6
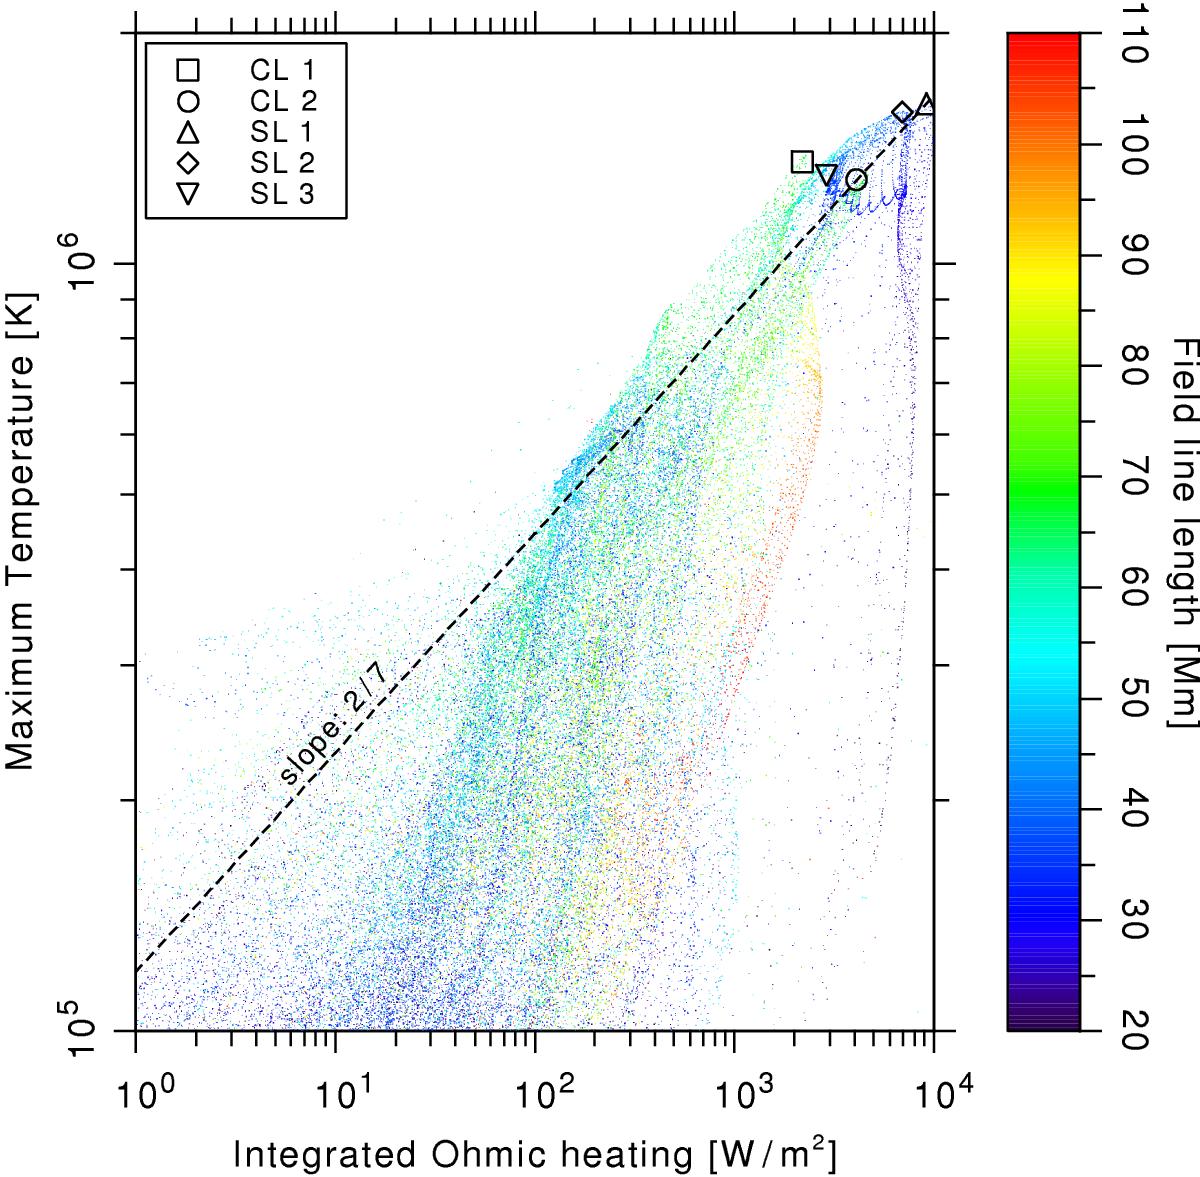
Volumetric Ohmic heating integrated along a field line () versus its maximum temperature (). The hottest loops (marked with symbols) all have a high Ohmic heating. The three loops with the strongest EUV emission (SL 1+2 and CL 1) lie exactly at the local maxima of their surrounding population. The dashed black line indicates the exponent of 2/7 with the parameters of the loop SL 1 as anchor point, see Sect. 4.1.2.
Current usage metrics show cumulative count of Article Views (full-text article views including HTML views, PDF and ePub downloads, according to the available data) and Abstracts Views on Vision4Press platform.
Data correspond to usage on the plateform after 2015. The current usage metrics is available 48-96 hours after online publication and is updated daily on week days.
Initial download of the metrics may take a while.