Fig. 3
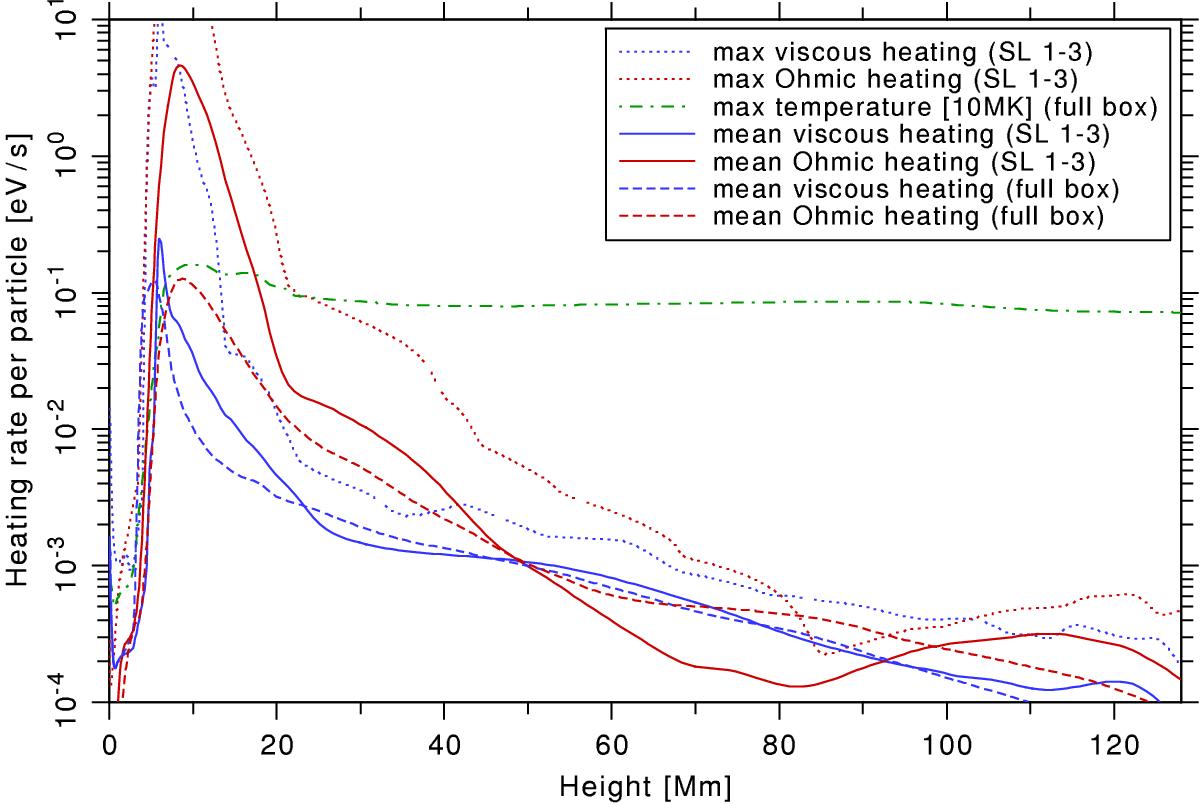
Similar to Fig. 2, but for the heating per particle. Horizontal averages of Ohmic (red) and viscous heating per particle (blue) versus height. The dotted curves indicate the maximum values at each height, while the solid lines show the corresponding mean value. Overplotted is the height profile of the maximum temperature (green dash-dotted). The different FOVs are symbolized as line styles and are given in brackets in the legend.
Current usage metrics show cumulative count of Article Views (full-text article views including HTML views, PDF and ePub downloads, according to the available data) and Abstracts Views on Vision4Press platform.
Data correspond to usage on the plateform after 2015. The current usage metrics is available 48-96 hours after online publication and is updated daily on week days.
Initial download of the metrics may take a while.