Fig. 1
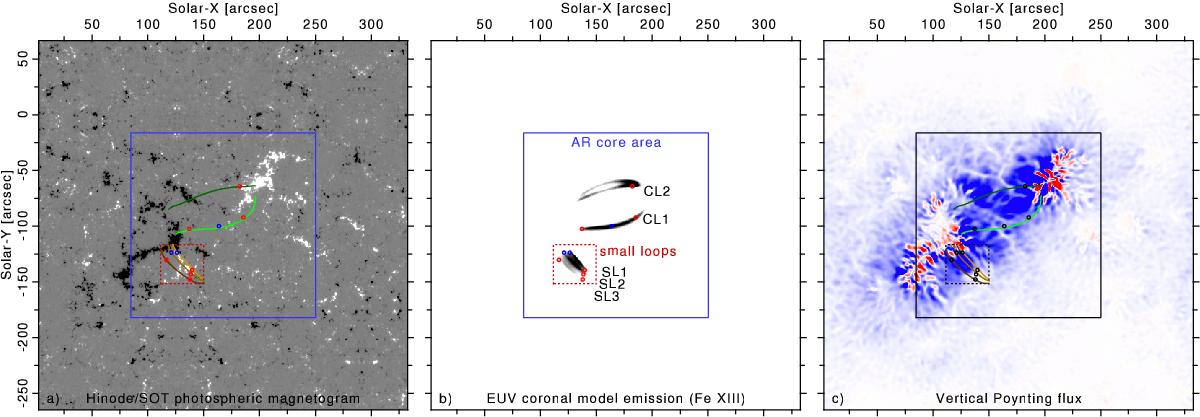
Active region observed by the Hinode satellite on 14 Nov. 2007. Left panel: line-of-sight magnetogram (saturation level: ± 300 G) of the AR including magnetic field lines along the most prominent coronal loops (CL 1–2 and SL 1–3, see Bourdin et al. 2013). Middle panel: Fe xiii EUV emission synthesized from the model data. The footpoints of the loops are marked with circles, where blue indicates plasma upflows and red downflows. Right panel: vertical component of the Poynting flux at 3 Mm height. Upwards oriented vertical flux is colored in blue and downwards flux in red, both in linear scale with a saturation level of ± 50 000 W/m2. The solid square indicates the hot AR core area, while the dotted rectangle outlines the FOV of only the short loops SL 1–3, see also Sect. 3.4.
Current usage metrics show cumulative count of Article Views (full-text article views including HTML views, PDF and ePub downloads, according to the available data) and Abstracts Views on Vision4Press platform.
Data correspond to usage on the plateform after 2015. The current usage metrics is available 48-96 hours after online publication and is updated daily on week days.
Initial download of the metrics may take a while.