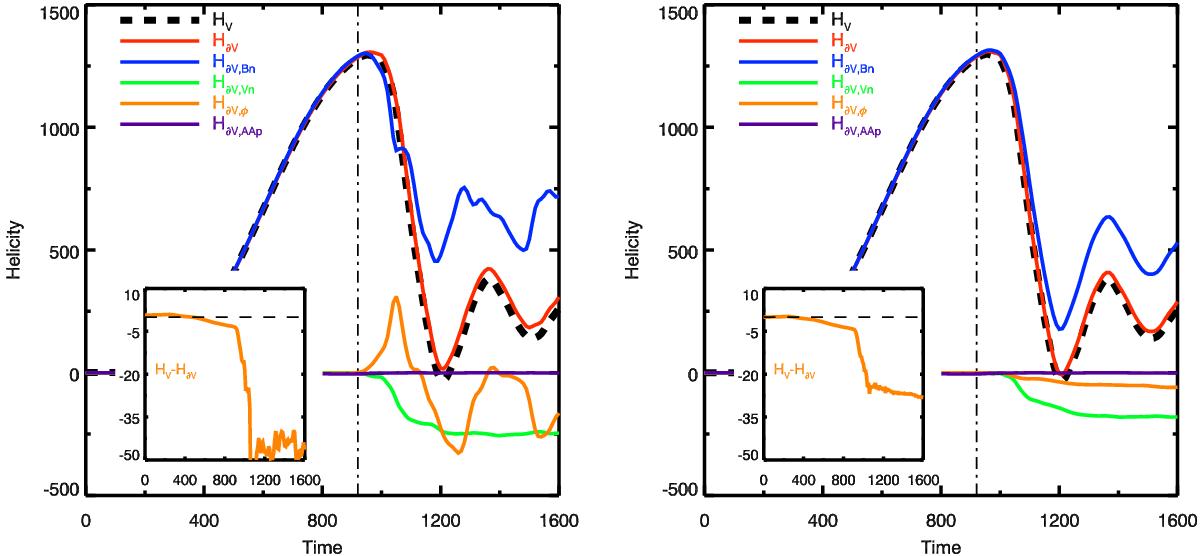
Fig. 9
![]() and
H∂𝒱,#
evolution in the system computed with different gauges. The left panel
has been computed with the practical DeVore method, while the right
panel has been derived with the DeVore-Coulomb method. The helicity
variation (
and
H∂𝒱,#
evolution in the system computed with different gauges. The left panel
has been computed with the practical DeVore method, while the right
panel has been derived with the DeVore-Coulomb method. The helicity
variation (![]() ,
black dashed line) is derived from the volume-integration method. The
time-integrated helicity is
,
black dashed line) is derived from the volume-integration method. The
time-integrated helicity is ![]() (red line), which can be separated into the contribution of its different terms:
(red line), which can be separated into the contribution of its different terms:
![]() (blue line),
(blue line), ![]() (green line),
(green line), ![]() (orange line), and
(orange line), and ![]() (purple line). The orange line in the insets corresponds to the difference between
(purple line). The orange line in the insets corresponds to the difference between
![]() and
and ![]() .
.
Current usage metrics show cumulative count of Article Views (full-text article views including HTML views, PDF and ePub downloads, according to the available data) and Abstracts Views on Vision4Press platform.
Data correspond to usage on the plateform after 2015. The current usage metrics is available 48-96 hours after online publication and is updated daily on week days.
Initial download of the metrics may take a while.