Fig. 3
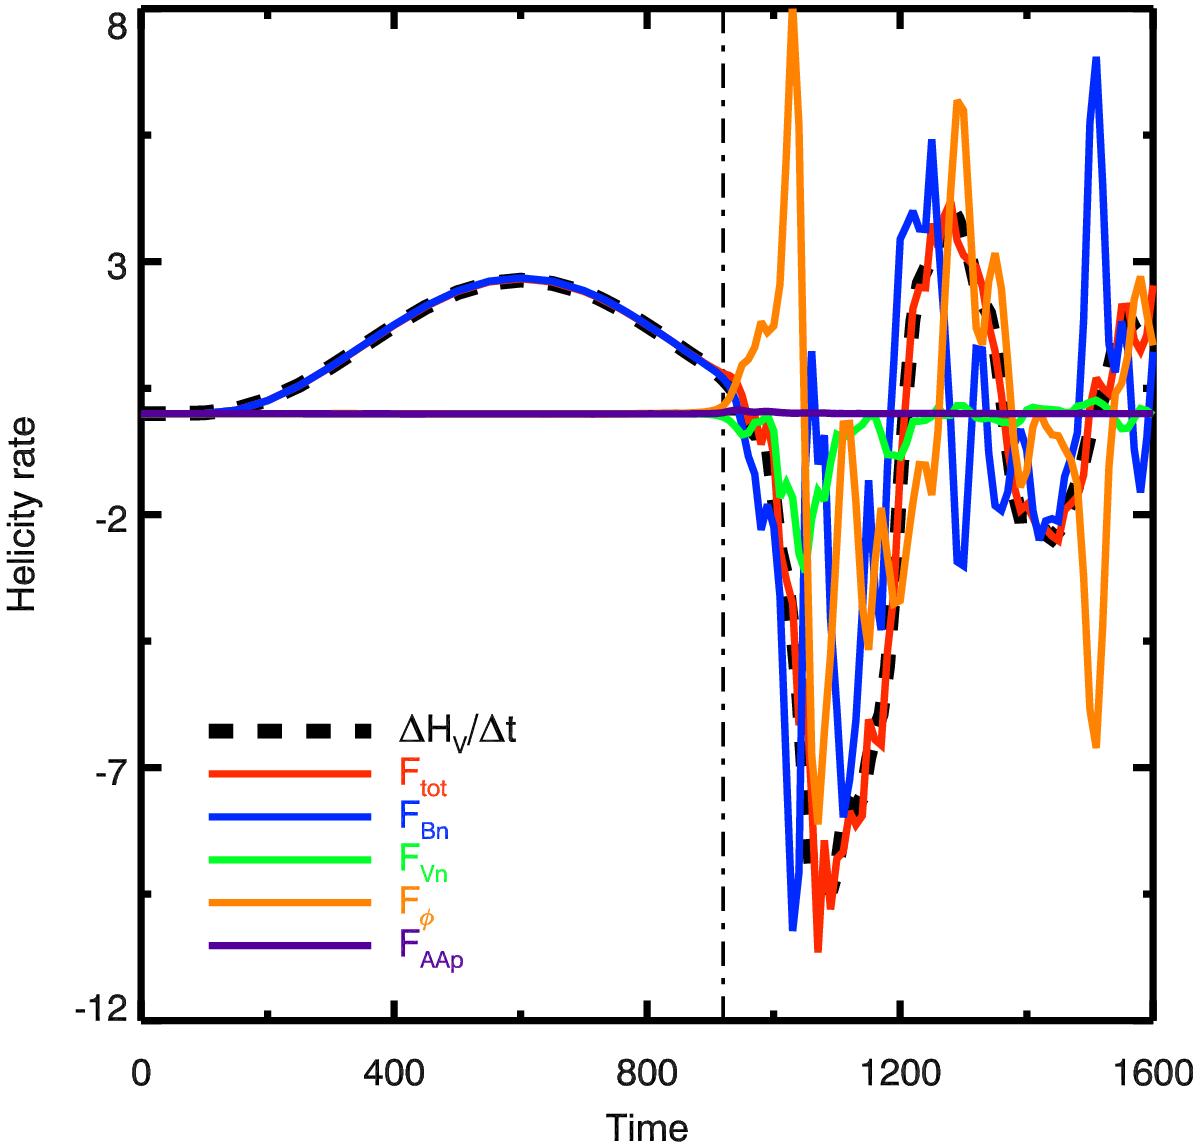
Comparison of the helicity variation rate and the helicity flux computed in the practical DeVore gauge. The helicity variation rate (![]() , dashed line) is derived from the volume-integration method. The total helicity flux through the whole surface,
, dashed line) is derived from the volume-integration method. The total helicity flux through the whole surface, ![]() , of the domain is Ftot (red line). This flux is composed of Eqs. (26)−(29): FVn (green line), FBn (blue line), Fφ (orange line), and FAAp (purple line).
, of the domain is Ftot (red line). This flux is composed of Eqs. (26)−(29): FVn (green line), FBn (blue line), Fφ (orange line), and FAAp (purple line).
Current usage metrics show cumulative count of Article Views (full-text article views including HTML views, PDF and ePub downloads, according to the available data) and Abstracts Views on Vision4Press platform.
Data correspond to usage on the plateform after 2015. The current usage metrics is available 48-96 hours after online publication and is updated daily on week days.
Initial download of the metrics may take a while.