Fig. 2
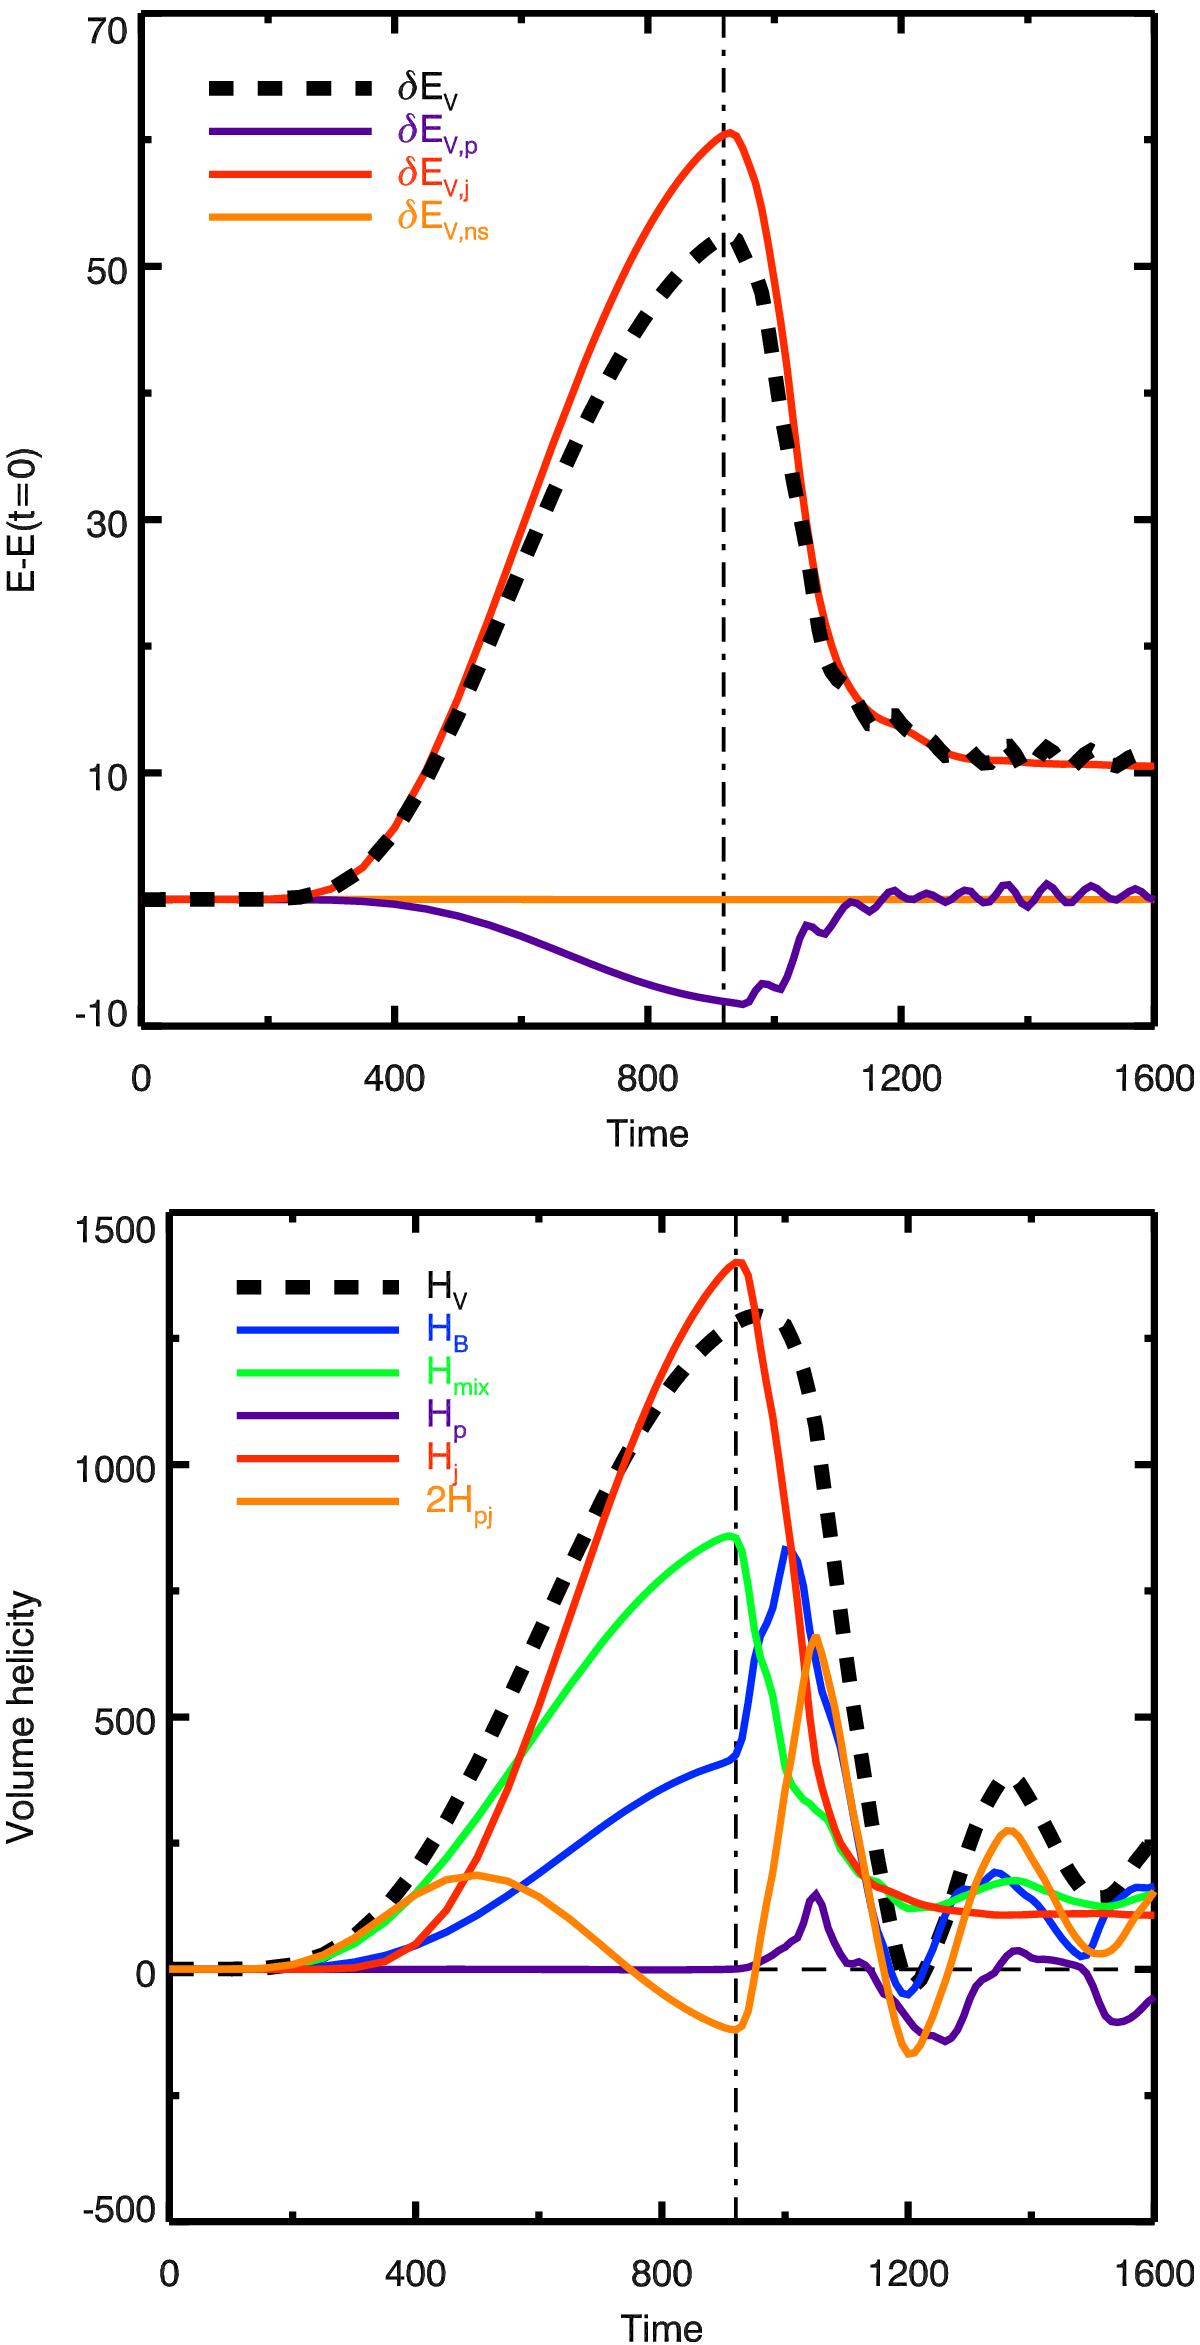
Top panel: time evolution of the different magnetic energies relative to their respective initial values: total (![]() , black dashed line), of the potential magnetic fields (
, black dashed line), of the potential magnetic fields (![]() , purple line), of the non-solenoidal component (
, purple line), of the non-solenoidal component (![]() , orange line), and free magnetic energy (
, orange line), and free magnetic energy (![]() , red line). Bottom panel: relative magnetic helicity (
, red line). Bottom panel: relative magnetic helicity (![]() , black dashed line) and its decompositions, Eqs. (11), (15), computed with the practical DeVore method: proper helicity (Hm, blue line), potential field helicity (Hp, purple line), and the mixed helicity (Hmix, green line); current-carrying helicity (Hj, red line), mutual helicity between potential and current-carrying fields (Hpj, orange line). In both panels, as in all figures hereafter, the dot-dashed vertical line at t = 920 indicates the transition between the quasi-ideal-MHD/energy accumulation and the non-ideal/jet-generation phases.
, black dashed line) and its decompositions, Eqs. (11), (15), computed with the practical DeVore method: proper helicity (Hm, blue line), potential field helicity (Hp, purple line), and the mixed helicity (Hmix, green line); current-carrying helicity (Hj, red line), mutual helicity between potential and current-carrying fields (Hpj, orange line). In both panels, as in all figures hereafter, the dot-dashed vertical line at t = 920 indicates the transition between the quasi-ideal-MHD/energy accumulation and the non-ideal/jet-generation phases.
Current usage metrics show cumulative count of Article Views (full-text article views including HTML views, PDF and ePub downloads, according to the available data) and Abstracts Views on Vision4Press platform.
Data correspond to usage on the plateform after 2015. The current usage metrics is available 48-96 hours after online publication and is updated daily on week days.
Initial download of the metrics may take a while.