Fig. 1
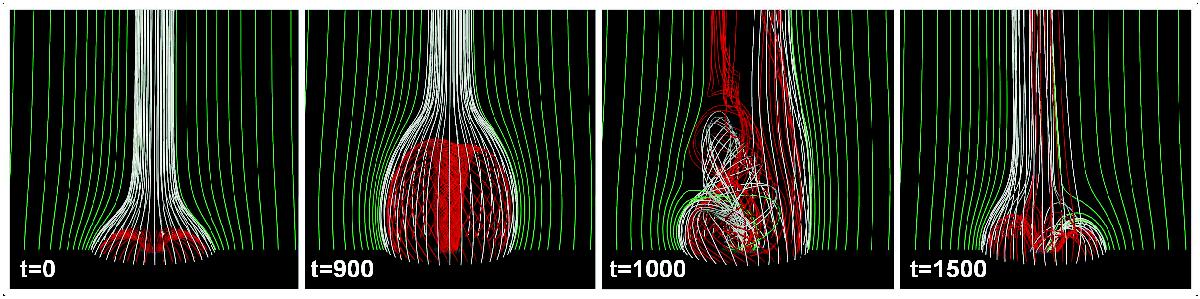
Snapshots of the magnetic field evolution during the generation of the jet. The red field lines are initially closed. The green and white field lines are initially open. All the field lines are plotted from fixed footpoints. The red and white field lines are regularly plotted along a circle of constant radius, while the green field lines are plotted along the x-axis. At t = 900 the system is in its pre-eruption stage. It is close to the maximum of energy and helicity. All the helicity is stored in the close domain. At t = 1000 the system is erupting. Numerous field lines have changed their connectivity, as can be observed from the open red field lines and the closed white field lines. Helicity is ejected upward along newly opened reconnected field lines. At t = 1500 the system is slowly relaxing to its final stage.
Current usage metrics show cumulative count of Article Views (full-text article views including HTML views, PDF and ePub downloads, according to the available data) and Abstracts Views on Vision4Press platform.
Data correspond to usage on the plateform after 2015. The current usage metrics is available 48-96 hours after online publication and is updated daily on week days.
Initial download of the metrics may take a while.