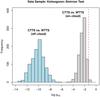
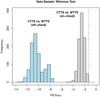
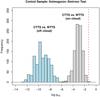
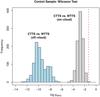
Fig. 4
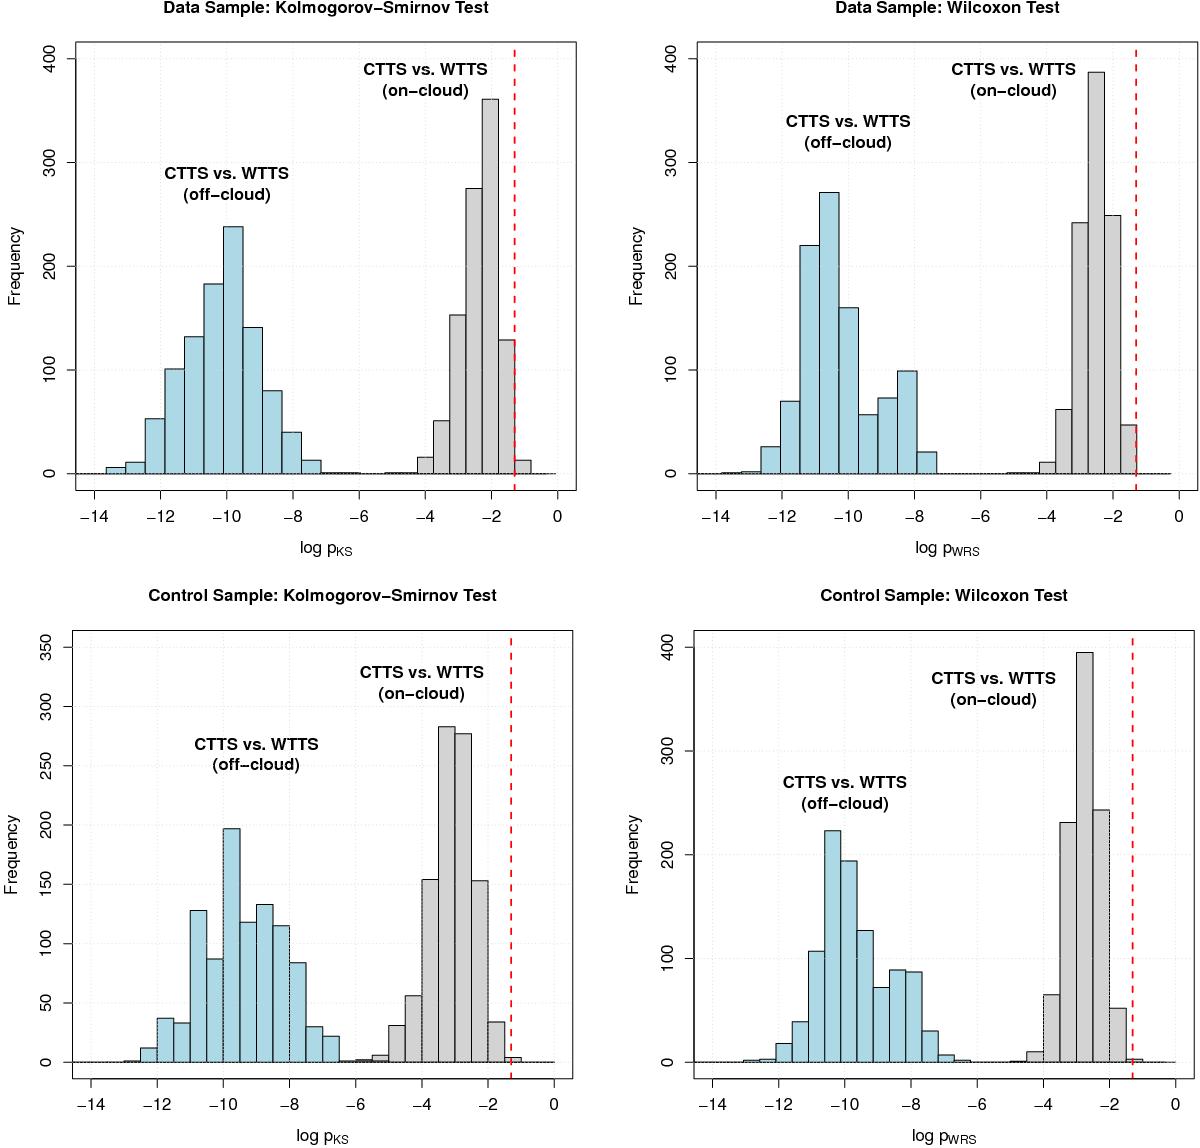
Histogram of probabilities (i.e., p-value) obtained from the Kolmogorov-Smirnov (left panels) and Wilcoxon tests (right panels) for the age distributions of the CTTSs and WTTSs in our data sample (upper panels) and control sample (lower panels) after 1000 Monte Carlo realizations. The red dashed line indicates the significance level of α = 0.05.
Current usage metrics show cumulative count of Article Views (full-text article views including HTML views, PDF and ePub downloads, according to the available data) and Abstracts Views on Vision4Press platform.
Data correspond to usage on the plateform after 2015. The current usage metrics is available 48-96 hours after online publication and is updated daily on week days.
Initial download of the metrics may take a while.